This tool is useful for measuring the behaviour and performance of individual pages.
Can be used to monitor page load and performance
It has three states:
- On,
- Off,
- On demand.
Activating the Developer Dashboard
Developer Dashboard is a utility that is available in all SharePoint 2010 versions, and can be enabled in a few different ways:
- PowerShell
- STSADM.exe
- SharePoint Object Model (API’s)
Activate the Developer Dashboard using STSADM.EXE
The Developer Dashboard state can only be toggled with a STSADM command
- ON:
STSADM –o setproperty –pn developer-dashboard –pv on
- OFF:
STSADM –o setproperty –pn developer-dashboard –pv off
- ON DEMAND:
STSADM –o setproperty –pn developer-dashboard –pv ondemand
Activate the Developer Dashboard using PowerShell:
$DevDashboardSettings = [Microsoft.SharePoint.Administration.SPWebService]::
ContentService.DeveloperDashboardSettings;
$DevDashboardSettings.DisplayLevel = ‘OnDemand’;
$DevDashboardSettings.RequiredPermissions =’EmptyMask’;
$DevDashboardSettings.TraceEnabled = $true;
$DevDashboardSettings.Update()
Activate the Developer Dashboard using the SharePoint Object Model
using Microsoft.SharePoint.Administration;
SPWebService svc = SPContext.Current.Site.WebApplication.WebService; svc.DeveloperDashboardSettings.DisplayLevel=SPDeveloperDashboardLevel.Off; svc.DeveloperDashboardSettngs.Update();
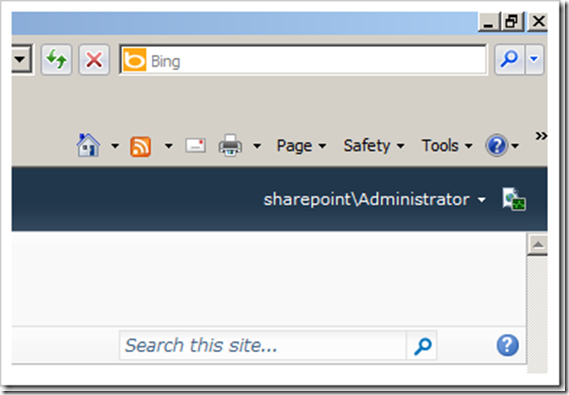
Where is it?
You can see the Developer Dashboard button In the top right.
Developer Dashboard 3 Border Colors
- it has a Green border, that generally means it’s loading quick enough not to be a real problem.
- It can also render Yellow, which indicates that there’s a slight delay and
- it could render a Red border which would mean you definitely need to look into it immediately!
You see this Developer Dashboard has a yellow border color.

