Category Archives: Tools

CRM Bulk Export Tool Available for CRM 4.0 and CRM Online!!

CRM 4.0 Bulk Data Export Tool

There is no facility to Bulk Export the data from Microsoft Dynamics CRM 4.0. This sample tool  allows users to connect to OnPremise or Online Microsoft CRM 4.0 organization and export data for CRM entities in form of CSV files.

Once you have installed the tool, launch CrmDataExport.exe, select CRM configuration and specify the credentials:

If you are connecting to OnPremise CRM Organization, make sure to open Internet Explorer, connect to CRM server and Save Password. This is necessary as this tool uses stored credentials to connect to the CRM server in OnPremise configuration.

Once you are connected successfully, you can select the entities for which you want to export the records, specify output directory, data and field delimiters, and duration. Note that All Records option is not available for Online configuration. Click Export button to export the records.

The tool creates CSV for each selected entities in the directory selected.

For this and other Web Parts, Templates, Apps, Toolkits,etc for MS CRM, SharePoint, Office 365, contact me at tomas.floyd@outlook.com

crmexporttool

A Look at : ‘Kaizan” and its Philospophy in Kanban

kaizen%20not%20kaizan[1]

Kaizen, or rapid improvement processes, often is considered to be the “building block” of all lean production methods. Kaizen focuses on eliminating waste, improving productivity, and achieving sustained continual improvement in targeted activities and processes of an organization.

Lean production is founded on the idea of kaizen – or continual improvement. This philosophy implies that small, incremental changes routinely applied and sustained over a long period result in significant improvements. The kaizen strategy aims to involve workers from multiple functions and levels in the organization in working together to address a problem or improve a process.

The team uses analytical techniques, such as value stream mapping and “the 5 whys”, to identify opportunities quickly to eliminate waste in a targeted process or production area. The team works to implement chosen improvements rapidly (often within 72 hours of initiating the kaizen event), typically focusing on solutions that do not involve large capital outlays.

Periodic follow-up events aim to ensure that the improvements from the kaizen “blitz” are sustained over time. Kaizen can be used as an analytical method for implementing several other lean methods, including conversions to cellular manufacturing and just-in-time production systems.

Top of page

Method and Implementation Approach

Rapid continual improvement processes typically require an organization to foster a culture where employees are empowered to identify and solve problems. Most organizations implementing kaizen-type improvement processes have established methods and ground rules that are well communicated in the organization and reinforced through training. The basic steps for implementing a kaizen “event” are outlined below, although organizations typically adapt and sequence these activities to work effectively in their unique circumstances.

Phase 1: Planning and Preparation. The first challenge is to identify an appropriate target area for a rapid improvement event. Such areas might include: areas with substantial work-in-progress; an administrative process or production area where significant bottlenecks or delays occur; areas where everything is a “mess” and/or quality or performance does not meet customer expectations; and/or areas that have significant market or financial impact (i.e., the most “value added” activities).

Once a suitable production process, administrative process, or area in a factory is selected, a more specific “waste elimination” problem within that area is chosen for the focus of the kaizen event ( i.e., the specific problem that needs improvement, such as lead time reduction, quality improvement, or production yield improvement). Once the problem area is chosen, managers typically assemble a cross-functional team of employees.

It is important for teams to involve workers from the targeted administrative or production process area, although individuals with “fresh perspectives” may sometimes supplement the team. Team members should all be familiar with the organization’s rapid improvement process or receive training on it prior to the “event”. Kaizen events are generally organized to last between one day and seven days, depending on the scale of the targeted process and problem. Team members are expected to shed most of their operational responsibilities during this period, so that they can focus on the kaizen event.

Phase 2: Implementation. The team first works to develop a clear understanding of the “current state” of the targeted process so that all team members have a similar understanding of the problem they are working to solve. Two techniques are commonly used to define the current state and identify manufacturing wastes:

  • Five Whys. Toyota developed the practice of asking “why” five times and answering it each time to uncover the root cause of a problem. An example is shown below.Repeating “Why” Five Times1
    1. Why did the machine stop?
      There was an overload, and the fuse blew.
    2. Why was there an overload?
      The bearing was not sufficiently lubricated.
    3. Why was it not lubricated sufficiently?
      The lubrication pump was not pumping sufficiently.
    4. Why was it not pumping sufficiently?
      The shaft of the pump was worn and rattling.
    5. Why was the shaft worn out?
      There was no strainer attached, and metal scrap got in.
  • Value Stream Mapping. This technique involves flowcharting the steps, activities, material flows, communications, and other process elements that are involved with a process or transformation (e.g., transformation of raw materials into a finished product, completion of an administrative process). Value stream mapping helps an organization identify the non-value-adding elements in a targeted process. This technique is similar to process mapping, which is frequently used to support pollution prevention planning in organizations. In some cases, value stream mapping can be used in phase 1 to identify areas for which to target kaizen events.

During the kaizen event, it is typically necessary to collect information on the targeted process, such as measurements of overall product quality; scrap rate and source of scrap; a routing of products; total product distance traveled; total square feet occupied by necessary equipment; number and frequency of changeovers; source of bottlenecks; amount of work-in-progress; and amount of staffing for specific tasks. Team members are assigned specific roles for research and analysis. As more information is gathered, team members add detail to value stream maps of the process and conduct time studies of relevant operations (e.g., takt time, lead-time).

Once data is gathered, it is analyzed and assessed to find areas for improvement. Team members identify and record all observed waste, by asking what the goal of the process is and whether each step or element adds value towards meeting this goal. Once waste, or non-value added activity, is identified and measured, team members then brainstorm improvement options. Ideas are often tested on the shopfloor or in process “mock-ups”. Ideas deemed most promising are selected and implemented. To fully realize the benefits of the kaizen event, team members should observe and record new cycle times, and calculate overall savings from eliminated waste, operator motion, part conveyance, square footage utilized, and throughput time.

Phase 3: Follow-up. A key part of a kaizen event is the follow-up activity that aims to ensure that improvements are sustained, and not just temporary. Following the kaizen event, team members routinely track key performance measures (i.e., metrics) to document the improvement gains. Metrics often include lead and cycle times, process defect rates, movement required, square footage utilized, although the metrics vary when the targeted process is an administrative process. Follow-up events are sometimes scheduled at 30 and 90-days following the initial kaizen event to assess performance and identify follow-up modifications that may be necessary to sustain the improvements. As part of this follow-up, personnel involved in the targeted process are tapped for feedback and suggestions. As discussed under the 5S method, visual feedback on process performance are often logged on scoreboards that are visible to all employees.

Top of page

Implications for Environmental Performance

Potential Benefits:
At its core, kaizen represents a process of continuous improvement that creates a sustained focus on eliminating all forms of waste from a targeted process. The resulting continual improvement culture and process is typically very similar to those sought under environmental management systems (EMS), ISO 14001, and pollution prevention programs. An advantage of kaizen is that it involves workers from multiple functions who may have a role in a given process, and strongly encourages them to participate in waste reduction activities. Workers close to a particular process often have suggestions and insights that can be tapped about ways to improve the process and reduce waste. Organizations have found, however, that it is often difficult to sustain employee involvement and commitment to continual improvement activities (e.g., P2, environmental management) that are not necessarily perceived to be directly related to core operations. In some cases, kaizen may provide a vehicle for engaging broad-based organizational participation in continual improvement activities that target, in part, physical wastes and environmental impacts.
Kaizen can be a powerful tool for uncovering hidden wastes or waste-generating activities and eliminating them.
Kaizen focuses on waste elimination activities that optimize existing processes and that can be accomplished quickly without significant capital investment. This creates a higher likelihood of quick, sustained results.
Potential Shortcomings:
Failure to involve environmental personnel in a quick kaizen event can potentially result in changes that do not satisfy applicable environmental regulatory requirements (e.g., waste handling requirements, permitting requirements). Care should be taken to consult with environmental staff regarding changes made to environmentally sensitive processes.
Failure to incorporate environmental considerations into kaizen can potentially result in solutions that do not consider inherent environmental risk associated with new processes. For example, an organization might select a change in process chemistry that addresses one improvement need (e.g., product quality, process cycle time) but that might be sub-optimal if the organization considered the material hazards or toxicity and the associated chemical and hazardous waste management obligations.
By not explicitly incorporating environmental considerations into kaizen, valuable pollution prevention and sustainability opportunities may be disregarded. For example, an evident opportunity to conserve water resources may not be explored if water use is not expensive and therefore not considered a wasteful expense that needs to be addressed. Similarly, including environmental considerations in the kaizen event goals can lead to solutions that rely less on hazardous materials or that create less hazardous wastes.

Useful Resources

Productivity Press Development Team. Kaizen for the Shopfloor (Portland, Oregon: Productivity Press, 2002).

Soltero, Conrad and Gregory Waldrip. “Using Kaizen to Reduce Waste and Prevent Pollution.” Environmental Quality Management (Spring 2002), 23-37.

How To : Use Git Tools for TFS Integration

Git – TFS Integration – Why it matters

 taking-your-version-control-to-a-next-level-with-tfs-and-git-1-638[1]

For many small development shops, the idea of using TFS and a centralized source control repository is anathema. The mere thought of being restricted by a software configuration manager on how and when to branch or merge cuts against everything they cherish in software development.


Git is their natural and chosen ground for managing source code. The freedom and flexibility of using Git enables them to work where they are. This is especially true if they are working as part of a distributed team on modular projects.

Microsoft addressed many of the existing concerns with TFS source control with the advent of TFS 2012 and local workspaces. However, even though local workspaces enable great flexibility in offline work, they are still ultimately tied to a central repository and the policies and restrictions imposed on it.


Enter Git support in TFS. Git support currently comes in two forms; stand alone Git support in Visual Studio and Git support with TFS.

Git support with Visual Studio is completely straightforward. Simply change the source control plug-in selection to the Microsoft Git Provider and all the power and flexibility of Git is available to the Visual Studio developer such as private branches and online collaboration with Git hosts such as GitHub and BitBucket.

Source

Configuring Git for Visual Studio Source Control

However, from an ALM perspective, the real power and the compelling feature of Microsoft’s integration with Git is the ability to work with TFS.


Developers still get all the advantages and flexibility of Git, but can also take advantage of the ALM features of TFS such as work item tracking, team tools and integrated build. The Git – TFS integration gets us much closer to the ultimate goal of true cross-platform support in a single ALM toolset.


The TFS – Git integration can be utilized a couple of ways. The first option is the ability to essentially synchronize a Git repository with TFS source control with the Git-TF utility. This utility makes it easy to clone sources from TFS, fetch updates from TFS and push changes back to TFS.


What’s more, it fully supports TFS shelvesets and work item integration, which presents some exciting possibilities. The features and functionality Git-TF provides makes it a compelling solution and a credible compromise between centrally managed teams with source control and distributed teams with distributed source control.

The second option, available now only through Microsoft’s hosted TFS Service, is the ability for organizations to create TFS Team Projects with Git hosted source control (this ability is reportedly planned for on premise TFS support in the next release). This is a fairly exciting development.


Having the choice between native TFS version control and Git when creating a team project opens many doors that hitherto were locked shut.

remoteRepo1

XCode IDE connected to a TFS hosted repository

Eclipse, XCode, Visual Studio and any other IDE that supports Git can now be used to leverage the powerful ALM features TFS provides.

As an ALM consultant, that’s the part that excites me the most. Hosting all development efforts in a single environment; an environment that supports all the various technologies in play and being able to track and manage those efforts with agility and transparency is a huge benefit to any organization that provides multiple platform solutions.


Even those who don’t, will now have the option to at least evaluate the feasibility of utilizing TFS in development environments not typically associated with a Microsoft project.

The mythical promised land of cross-platform ALM may have just become quite less mythical.


———————Microsoft’s Tool for Git and TFS Integration – ———————————————————————–

 http://gittf.codeplex.com

2352.vs_5F00_heart_5F00_git_5F00_thumb_5F00_66558A9C[1]

Working with Teams

The Git-TF tool is most easily used by a single developer or multiple developers working independently with their own isolated Git repos. That is, each developer uses Git-TF to clone a local repo where they can then use Git to manage their local development that will eventually be checked in to TFS. In this “hub and spoke” configuration, all code is shared through TFS at the “hub” and each developer using Git becomes a “spoke”. Developers looking to collaborate using Git’s distributed sharing capabilities will want to work in a specific configuration described below.

Most often, developers collaborating with Git have cloned from a common repo. When it comes time to share divergent changes, conflict resolution is easy because each repository shares the same common base version. Many times, conflicts are automatically resolved. One of the keys to this merging of histories is that each commit is assigned a unique identifier that is generated by the contents of the commit. When working with Git-TF, two repositories cloned from the same TFS path will not have the same commit IDs unless the clones were done at the same point in TFS history, and with the same depth. In the event that two Git repos that were independently cloned using Git-TF share changes directly, the result will be a baseless merge of the repositories and a large number of conflicts. For this reason, it is not recommended that teams using Git-TF ever share changes directly through Git (i.e. using git push and git pull).

Instead, it is recommended that a team working with Git-TF and collaborating with Git do so by designating a single repo as the point of contact with TFS. This configuration may look as follows for a team of three developers:

          [TFS]      [Shared Git repo]
            |         ^ (2)  |       \
            |        /       |        \
            |       /        |         \
            V (1)  /         V (3)      V (4)
       [Alice's Repo]   [Bob's Repo]   [Charlie's Repo]
 

In the configuration above the actions would be as follows:

  1. Using the git tf clone command, Alice clones a path from TFS into a local Git repo.
  2. Next, Alice uses git push to push the commit created in her local Git repo into the team’s shared Git repo.
  3. Bob can then use git clone to clone down the changes that Alice pushed.
  4. Charlie can also use git clone to clone down the changes that Alice pushed.

Both Bob and Charlie only ever interact with the team’s shared Git repo using git push and git pull. They can also interact directly with one another’s repos (or with Alice’s) , but should never use Git-TF commands to interact with TFVC.

When working with the team, Alice will typically develop locally and use git push and git pull to share changes with the team. When the team decides they have changes to share with TFS, Alice will use a git tf checkin to share those changes (typically a git tf checkin –shallow will be used). Likewise, if there are changes that the team needs from TFVC, Alice will perform a git tf pull, using the –merge or –rebase options as appropriate, and then use git push to share the changes with the team.

Note that (until Issue 77 is addressed) all changes coming into the TFVC repository will come in as if from Alice’s TFS identity. This is fine if only Alice has an identity on that TFVC project but it may well not be what you want if Bob and Charlie also had valid identities in that TFS project.

Rebase vs. Merge

Once changes have been fetched from TFS using git tf pull (or git tf fetch), those changes must either be merged with the HEAD or have any changes since the last fetch rebased on top of FETCH_HEAD. Git-TF allows developers to work in either manner, though if the repo that is sharing changes with TFS has shared any commits with other Git users, then this rebase may result in significant conflicts (see The Perils of Rebasing). For this reason, it is recommended that any team working in the aforementioned team configuration use git tf pull with the default –merge option (or use git merge FETCH_HEAD to incorporate changes made in TFS after fetching manually).

Recommended Git Settings

When using the Git-TF tools, there are a few recommended settings that should make it easier to work with other developers that are using TFS.

Line Endings

core.autocrlf = false

Git has a feature to allow line endings to be normalized for a repository, and it provides options for how those line endings should be set when files are checked out. TFS does not have any feature to normalize line endings – it stores exactly what is checked in by the user. When using Git-TF, choosing to normalize line endings to Unix-style line endings (LF) will likely result in TFS users (especially those using VS) changing the line endings back to Windows-style line endings (CRLF). As a result, it is recommended to set the core.autocrlf option to false, which will keep line endings unchanged in the Git repo.

Ignore case

core.ignorecase = true

TFS does not allow multiple files that differ only in case to exist in the same folder at the same time. Git users working on non-Windows machines could commit files to their repo that differ only in case, and attempting to check in those changes to TFS will result in an error. To avoid these types of errors, the core.ignorecase option should be set to true.

How To : Use Azure BizTalk Services to Integrate with an On-Premises SAP Server

biztalk_adapter_2004-1[1]hero-for-hire_basic-layout_600

Microsoft Azure BizTalk Services provides a rich set of integration capabilities enabling organizations to create hybrid solutions such that their customer or partner facing applications are hosted on Azure, while the data related to customers or partners is stored on-premises using LOB applications.

To demonstrate how to integrate applications with an on-premises LOB application using BizTalk Services, let us consider a scenario involving two business partners, Fabrikam and Contoso.

Business Scenario

Contoso sends a purchase order (PO) message to Fabrikam in an X12 Electronic Data Interchange (EDI) format using the PO (X12 850) schema. Fabrikam (that uses an SAP Server to manage partner data), accepts PO from its partners using the ORDERS05 IDOCS.

To enable Contoso to send a PO directly to Fabrikam’s on-premises SAP Server, Fabrikam decides to use Azure’s integration offering, BizTalk Services, to set up a hybrid integration scenario where the integration layer is hosted on and the SAP Server is within the organization’s firewall. Fabrikam uses BizTalk Services in the following ways to enable this hybrid integration scenario:

  1. Fabrikam uses Microsoft Azure BizTalk Services SDK to create a BizTalk Service project. The project includes a XML One-Way Bridge to send messages to a relay endpoint, which in turns sends the message to the on-premise SAP system.
  2. Fabrikam uses the BizTalk Adapter Service component available with BizTalk Services to expose the Send operation on ORDERS05 IDOC as an operation using Service Bus relay endpoint. The XML One-Way Bridge sends messages to this relay endpoint. Fabrikam also creates the schema for Send operation using BizTalk Adapter Service and includes the schema as part of the BizTalk Service project.
    noteNote
    A Send operation on an IDOC is an operation that is exposed by the BizTalk Adapter Pack on any IDOC to send the IDOC to the SAP Server. BizTalk Adapter Service uses BizTalk Adapter Pack to connect to an SAP Server.
  3. Fabrikam uses the Transform component available with BizTalk Services to create a map to transform the PO message in X12 format into the schema required by the SAP Server to invoke the Send operation on the ORDERS05 IDOC.
  4. Fabrikam uses the Microsoft Azure BizTalk Services Portal available with BizTalk Services to create and deploy an EDI agreement under the BizTalk Services subscription that processes the X12 850 PO message. As part of the message processing, the agreement also does the following:
    1. Receives an X12 850 PO message over FTP.
    2. Transforms the X12 PO message into the schema required by the SAP Server using the transform created earlier.
    3. Routes the transformed message to the XML One-Way Bridge that eventually routes the message to a relay endpoint created for sending a PO message to an SAP Server. Fabrikam earlier exposed (as explained in bullet 1 above) the Send operation on ORDERS05 IDOC as a relay endpoint, to enable partners to send PO messages using BizTalk Adapter Service.

Once this is set up, Contoso drops an X12 850 PO message to the FTP location. This message is consumed by the EDI receive pipeline, which processes the message, transforms it to an ORDERS05 IDOC, and routes it to the intermediary XML bridge. The bridge then routes the message to the relay endpoint on Service Bus, which is then sent to the on-premises SAP Server. The following illustration represents the same scenario.

SAP Integraiton scenario

How to Use This Article


This tutorial is written around a sample, SAPIntegration, which is available as part of the download (SAPIntegration.zip) from the MSDN Code Gallery. You could either use the SAPIntegration sample and go through this tutorial to understand how the sample was built or just use this tutorial to create your own application.

This tutorial is targeted towards the second approach so that you get to understand how this application was built. Also, to be consistent with the sample, the names of artifacts (e.g. schemas, transforms, etc.) used in this tutorial are same as that in the sample.

The sample available from the MSDN code gallery contains only half the solution, which can be developed at design-time on your computer. The sample cannot include the configuration that you must do on the BizTalk Services Portal on Azure.

For that, you must follow the steps in this tutorial to set up your EDI bridge. Even though Microsoft recommends that you follow the tutorial to best understand the concepts and procedures, if you really wish to use the sample, this is what you should do:

  • Download the SAPIntegration.zip package, extract the SAPIntegration sample and make relevant changes like providing your service namespace, issuer name, issuer key, SAP Server details, etc. After changing the sample, deploy the application to get the endpoint URL at which the XML One-Way Bridge is deployed.
  • Use the BizTalk Services Portal to configure the Receive settings as described at Step 5: Create and Deploy the EDI Receive Pipeline and follow the procedures to route messages from the EDI Receive bridge to the XML One-Way Bridge you already deployed.
  • Drop a test message at the FTP location configured as part of the agreement and verify that the application works as expected.
    • If the message is successfully processed, it will be routed to the SAP Server and you can verify the ORDERS IDOC using the SAP GUI.
    • If the EDI agreement fails to process the message, the failure/error messages are routed to a relay endpoint on Service Bus. To receive such messages, you must set up a relay receiver service that receives any message that comes to that specific relay endpoint. More details on why you need this service and how to use it are available at Step 6: Test the Solution.

Steps in the Solution :


  • Step 1: Set up Your Computer
  • Step 2: Expose a Relay Endpoint to Invoke Operations on ORDERS05 IDOC
  • Step 3: Transform the X12 850 PO Message to the ORDERS05 Message
  • Step 4: Create and Deploy the XML Bridge
  • Step 5: Create and Deploy the EDI Receive Pipeline
  • Step 6: Test the Solution

Step 1: Set up Your Computer


This topic provides you with instruction and pointers to set up your computer on which you will perform the steps to set up the hybrid integration scenario described in Tutorial: Using Azure BizTalk Services to Integrate with an On-Premises SAP Server. You must do the following to set up your computer:

  • Install Microsoft Azure BizTalk Services SDK. You can download the installer from http://go.microsoft.com/fwlink/?LinkId=235057. You use this SDK to configure and deploy the XML One-Way Bridge that sits between the EDI agreement and the relay endpoint.
  • Install BizTalk Adapter Service. You use this to expose the Send operation on an IDOC as a relay endpoint on Service Bus.You can download the installer from http://go.microsoft.com/fwlink/?LinkId=235057. Refer to the BizTalk Services installation guide at http://go.microsoft.com/fwlink/?LinkId=237092 to install the software prerequisites for BizTalk Services SDK and BizTalk Adapter Service.
  • Install the WCF LOB Adapter SDK. This is required for installing the Adapter Pack on the computer.
  • Install the Adapter Pack. This contains the SAP adapter that is required to establish connectivity to an SAP Server and for exposing SAP artifacts as operations.
  • Install the SAP client libraries. The SAP adapter needs these libraries to connect to an SAP Server. For information on where to install the SAP client libraries from, refer to the Adapter Pack installation guide (BizTalkAdapterPack_InstallationGuide.htm) at http://go.microsoft.com/fwlink/?LinkId=240161.
  • Download and extract the EDI message schemas (MicrosoftEdiXSDTemplates.zip) available at http://go.microsoft.com/fwlink/?LinkId=235057. This contains the X12 850 Purchase Order message schema that is required for the business scenario we use for this article.

After you have finished installing and downloading these components, you are ready to start setting up the business scenario.

Step 2: Expose a Relay Endpoint to Invoke Operations on ORDERS05 IDOC

This topic has not yet been rated Rate this topic

Updated: November 21, 2013

There are two main steps required to expose an SAP artifact as an operation that can be invoked by sending a message over Service Bus – create an LOB Target and an LOB Relay.

  • An LOB Target defines how an Azure application communicates to the Line-of-Business (LOB) system. The LOB Target controls the LOB system connection URI, the operation to perform, and the connection credentials.
  • An LOB Relay is a WCF service running within an organizations firewall and listens to a relay endpoint on the Service Bus. As the name suggests, the LOB Relay acts as a relay between the Service Bus relay endpoint and the LOB system. It receives the message at the Service Bus relay endpoint and passes it on to the relevant LOB system using the LOB Target configuration.

For more information, see BizTalk Adapter Service Architecture. In this topic, we will create an LOB Target and an LOB Relay to expose the Send operation on the ORDERS05 IDOC.

To create an LOB Target and LOB Relay

  1. Open Visual Studio (as an administrator), create a new BizTalk Service project, and name it SAPIntegration.
  2. You first start with adding a BizTalk Adapter Service server. This is the server where you installed the Runtime component of BizTalk Adapter Service. To add a BizTalk Adapter Service server, from the Server Explorer in Visual Studio, right-click BizTalk Adapter Services, and select Add BizTalk Adapter Service. In the Add BizTalk Adapter Service dialog box, enter the URL of the WCF service that monitors that Service Bus relay service, and then click OK.

    Add Service Bus Connect ServerBecause you have all the components of BizTalk Adapter Service installed on the same computer, the URL for that service will be http://localhost:8080/BAService/ManagementService.svc/.

    noteNote
    If you had installed BizTalk Adapter Service Runtime component on a separate computer, you would have replaced ‘localhost’ in the above URL with the name of that computer.
  3. In this tutorial we are creating an application to integrate with SAP, so we must add an SAP target. Expand the newly added server, expand LOB Types, right-click SAP, and select Add SAP Target.

    Add an SAP TargetThe Add a Target wizard starts. Perform the following steps to create an LOB Target.

    1. Read the information on the Before You Begin page, and then click Next.
    2. On the Connection Parameters page, specify the details for the SAP Server to connect to and the credentials to use for the connection. Click Next.
    3. On the Operations page, expand the ORDERSO5 IDOC category (under \IDOC\ORDERS\). There are several versions of the IDOC available. For this tutorial, we’ll select ORDERS05.V3(700). Expand this IDOC, select Send, and then click the right arrow to add it to the Selected Operations box.

      Add Send operation for IDOCClick Next.

    4. In the Runtime Security page, specify the security mechanism to be used by the LOB Server to authenticate the target resource when a message arrives from a client. For this tutorial, select Fixed Username and specify the credentials to connect to the SAP server.
    5. On the Deployment page, you create an LOB Relay and an LOB Target to provide connectivity to your on-premise LOB applications from the cloud.

      Select the Create new option to create a new relay and provide the following values:

      Name Description
      Namespace Specify the Service Bus namespace on which the LOB relay endpoint is created.
      Issuer name Specify the issuer name for the Service Bus namespace
      Issuer secret Specify the issuer secret for the Service Bus namespace
      Relay path Specify a name for the relay. For this tutorial, enter sapintegration01.
      Target sub-path Enter a sub-path to make this target unique. For this tutorial, enter orders.

      The Target runtime URL read-only property displays the URL where the relay is deployed on Service Bus. This is the path where you could send a message to be inserted into the on-premises SAP Server. In our scenario, this is where the bridge sends the message.

      Click Next.

    6. On the Summary page, review the values you specified in the previous steps, and then click Create.
    7. When the wizard completes, click Finish.

      In Visual Studio Server Explorer, you now have an entry under the SAP node. This represents the relay endpoint created in Service Bus to relay PO messages coming from the cloud to the on-premises SAP system.

To add schemas

  1. After adding the relay endpoint to an SAP system, you must add schemas that to send ORDERS05 PO messages to the SAP server. To add the schemas, right-click the relay endpoint and select Add schemas to SAPIntegration. In the dialog box, do the following:
    • Enter a filename prefix that will be included in the name of each schema file that is generated. For this tutorial, specify this as SAPIntegration_.
    • Enter a folder name that will be added to your solution under which all the schemas will be added. For this tutorial, specify the folder name as LOB Schemas.
    • Enter the credentials to connect to an SAP system.

    Add schemas to the projectClick OK. The schemas are added to the project under an LOB Schemas folder.

To use the LOB Target

  1. Right-click anywhere on the BizTalk Service project design surface, select Properties and update the BizTalk Service URL property to include your BizTalk Services name. This is the name that you provided in Azure Management Portal while provisioning the BizTalk Services.
  2. Set the security property for the relay endpoint.
    1. Right-click the LOB Target in Server Explorer and select Properties.
    2. In the Properties grid, click the ellipsis (…) against the Runtime Security property.
    3. In the Edit Security dialog box, select Fixed Username and specify username and password to connect to the SAP Server.
    4. Click OK.
  3. Drag and drop the LOB Target onto the design surface. Note the Entity Name property of the LOB Target. The default value is Relay-Path_target-sub-path. If using the examples above, it will be sapintegration01_orders.
  4. Open the .config file for the LOB Target, which typically has the naming convention as YourRelayPath_target-sub-path.config. Specify the Service Bus issuer name and issuer secret, as shown below:
      <sharedSecret issuerName="owner" issuerSecret="issuer_secret" />


    Save changes to the config file.


Step 3: Transform the X12 850 PO Message to the ORDERS05 Message


Both the X12 850 schemas and ORDERS05 schemas are pretty complex and require functional expertise in the respective domains to understand and create maps between the two schemas.

While you already generated the schema for ORDERS05 IDOC, you can get the schema for X12 PO message (X12_00401_850.xsd) from the MicrosoftEdiXSDTemplates.zip that you must have downloaded and extracted before. You must add the X12_00401_850.xsd schema as well to the SAPIntegration project.

Creating a transform between the X12 850 PO and ORDERS05 PO requires functional domain knowledge of both the X12 schema and the ORDERS05 schema.

Only then one can identify which field in the X12 schema maps to which field in the ORDERS05 schema. In this tutorial, we do not get into such details and instead use an existing transform (AzureTransformations.trfm) between these two schemas. This transform is available as part of the SAPIntegration project that you can download from the MSDN Code Gallery.

To include the transform in the BizTalk Service project, right-click the project name, click Add, click Existing Items, and then navigate to the location where you downloaded the SAPIntegration sample from the MSDN Code Gallery. Select the AzureTransformations.trfm and then click Add.

Step 4: Create and Deploy the XML Bridge


In this topic, you create an XML One-Way Bridge that will act as a connector between the EDI Receive bridge and the relay endpoint for the ORDERS05 IDOC in SAP. After configuring the bridge, you connect it to the SAP relay endpoint, and then deploy the solution.

To configure the XML Bridge

  1. In the SAPIntegration project, from the Solution Explorer, double-click the MessageFlowItinerary.bcs file to open the bridge configuration surface.
  2. Right-click anywhere on the BizTalk Service project design surface, select Properties, and update the BizTalk Service URL property to include your BizTalk Services name. This is the name that you provided in Azure Management Portal while provisioning the BizTalk Services.
  3. From the Toolbox, drag and drop the XML One-Way Bridge component to the bridge design surface.
  4. Right-click the XML One-Way Bridge, select Properties, and change the value for Entity Name and Relative Address properties to B2BConnector. As a result, the complete endpoint URL where the bridge is deployed, which is shown in the Runtime Address property, will resemble https://<mybiztalkservicename>.biztalk.windows.net/default/B2BConnector. This is where the EDI Receive bridge sends the ORDERS05 PO message.
  5. Double-click the XML One-Way Bridge to open the Bridge Configuration design surface. Because this bridge only routes the message from the EDI Receive bridge to the relay endpoint, there’s not much configuration required for each stage in the bridge stage other than specifying the message types of the message that this bridge routes. To specify the message type, on the XML One-Way Bridge design surface, within the Message Types box, click the add icon [ Add icon ] to open the Message Type Picker dialog box.
  6. In the Message Type Picker dialog box, from the Available message types box, select the schema for the request message and then click the right arrow icon [ Arrow Icon ], and then click OK. For this tutorial, select the Send schema (http://Microsoft.LobServices.Sap/2007/03/Idoc/3/ORDERS05//700/Send). The selected schema should now be listed under the Request Message Type box.
  7. Save the bridge configuration.

To connect the bridge to the relay endpoint

  1. In the SAPIntegration project, from the Toolbox, select the Connection component, and connect the XML One-Way Bridge component with the SAP relay endpoint you already added in Step 2: Expose a Relay Endpoint to Invoke Operations on ORDERS05 IDOC.
  2. Set the filter condition on the connection. The routing condition for this scenario is to route all messages to the LOB Target. To do so, select the connecting line, and from the Properties grid, click the ellipsis (…) against the Filter Condition property, and then select Match All. This ensures that all messages that come to the bridge are routed to the relay endpoint.
  3. Set the Route Action property on the connection. Before you set the route action, we must understand why it is required. The message sent from the EDI receive bridge to the relay endpoint must have the Action SOAP header set on it. This header defines what operation must be performed on the SAP system. The message that comes from the EDI receive pipeline does not have this header set. Hence, in this intermediary XML bridge, you set the route action on the message before it is sent the relay endpoint. As part of the route action, you add the required header on the message. Perform the following steps to set the route action.
    1. Find out the value that will be set for the Action SOAP header message. To do so, right-click the SAP relay endpoint from the Server explorer, and from the Properties grid, expand Operations, and copy the value. For this tutorial, the value is http://Microsoft.LobServices.Sap/2007/03/Idoc/3/ORDERS05//700/Send.

      Value for SOAP action

    2. Go back to the bridge configuration surface, select the connection between the bridge and the SAP relay, and from the Properties grid, click the ellipsis (…) against the Route Action property. In the Route Actions dialog box, click Add to open the Add Route Action dialog box. In the Add Route Action dialog box, do the following:
      • Under Property (Read From) section, select Expression and specify the value that you copied earlier.
        ImportantImportant
        Make sure you specify the value for Expression within single quotes.
      • Under Destination (Write-To) section, set the Type to SOAP and the Identifier to Action.

        Set Route Action

      • Click OK in the Add Route Action dialog box to add the route action. Click OK in the Route Actions dialog box and then click Save to save changes to an Enterprise Application Integration project.
  4. Save the project. The final bridge configuration resembles the following:

    Completed bridge configuration

To deploy the solution

  1. In Visual Studio, right click the SAPIntegration solution, and then click Build Solution.
  2. Once the build succeeds, right click the SAPIntegration solution, and then click Deploy Solution.
  3. In the deployment window, the Deployment Endpoint is a read-only property and the value is derived from the BizTalk Service URL/Namespace set in the message flow surface. However, you must provide the ACS Namespace for BizTalk Services, Issuer Name, and Shared Secret.
  4. Click Deploy. The Visual Studio Output pane displays the deployment progress and result. The URL where the bridge is deployed is also displayed in the Output pane. For this tutorial, the bridge is deployed at http://<mybiztalkservicename>.biztalk.windows.net/default/B2BConnector.


A Look At : Application Management and Governance in SharePoint 2013

Summary:Learn how to govern applications for SharePoint 2013 by creating a customization policy and understanding the app model, branding, and life-cycle management.

8322.sharepoint_2D00_2010_5F00_4855E582[1]

How will you manage the applications that are developed for your environment? What customizations do you allow in your applications, and what are your processes for managing those applications?


For effective and manageable applications, your organization should consider the following:

  • Customization policy   SharePoint 2013 includes customizable features and capabilities that span multiple product areas, such as business intelligence, forms, workflow, and content management. Customization can introduce risks to the stability, maintenance, and security of the environment. To support customization while controlling its scope, you should develop a customization policy.
  • Life-cycle management   Follow best practices to manage applications and keep your environments in sync.
  • Branding   If you are designing an information architecture and a set of sites to use across an organization, consider including branding in your governance plan. A formal set of branding policies helps ensure that sites consistently use enterprise imagery, fonts, themes, and other design elements.
  • Solutions or apps for SharePoint?   Decide whether a solution or an app for SharePoint would be the best choice for specific customizations.

Get developer guidance about customizing and branding SharePoint 2013 on MSDN: Build sites for SharePoint 2013.

Foundation icon This article is part of a set of articles about governance. The following articles describe other aspects of governance:

The What is governance? poster gives a summary of this content. Download the PDF version or Visio version, or Zoom into the model in full detail with Zoom.it from Microsoft.

Determine the types of customizations you want to allow and how to manage them. Your customization policy should include:

  • Service-level descriptions   What are the parameters for supporting and managing customizations in your environments? See Service-level agreements.
  • Guidelines for updating customizations   How do you manage changes to customizations, and how do you roll out those changes to your environments? Consider ways to manage source code, such as a source control system and standards for documenting the code.
  • Processes for analyzing   How do you understand whether a particular customization is working well in your environment, or how do you decide which ones to create, change, or retire?
  • Approved tools for customization   Consider development standards, such as coding best practices and the tools that you will to use across your organization. For example, you should decide whether to allow the use of SharePoint Designer 2013 and Design Manager, and specify which site elements can be customized and by whom.
  • Process for piloting and testing customizations   How do you test and deploy customizations? How many people should be in a pilot testing group? What are your standards for testing and validating customizations?
  • Who is responsible for ongoing support   Who will be responsible for supporting customizations in your environments—individual teams or a central group?
  • Guidelines for packaging and deploying customizations   Do you have individual packages for each, or do you include several in a feature or solution? Which customizations should be apps for SharePoint instead of solutions? How do you ensure that customizations in one environment do not affect the rest of your SharePoint implementation?
  • Specific policies regarding each potential type of customization   What types of customizations do you allow?

    For more information about kinds of customizations and their potential risks, see the Customizations table later in this article. For more information about processes for managing customizations, see the white paper SharePoint Products and Technologies customization policy. Most of this content still applies to SharePoint 2013.

  • Policies around using the App Catalog and SharePoint Store Which apps for SharePoint do you want to make available to your organization? Can users purchase apps directly? See Solutions or apps for SharePoint? later in this article for more information.

The highly customizable design of SharePoint products enables you to provide the look, behavior, or functionality that meets your business needs. Customizations can introduce risk to your environment, whether that risk is to the environment’s performance, availability, or supportability. Conversely, a “no customizations” policy severely restricts your organization’s ability to take advantage of the SharePoint platform.

All customizations are not the same. You must decide carefully which kinds of customizations to allow in your environment. You must ensure the customizations support the performance, availability, and supportability you want for your environment. Your governance policy should balance a level of acceptable risk against the business needs for your organization.

What is considered a customization? All of the following are considered kinds of customizations in SharePoint products:

  • Configuration   Using the SharePoint user interface to configure SharePoint products.
  • Branding   Changing logos, styles, colors, master pages and page layouts, and so on to create a custom look for your SharePoint sites. See more about branding.
  • Custom code   Using developer tools to add or change functionality in SharePoint products or to interact with other applications. Risk can vary depending on kind of functionality and level of trust (full trust solutions should be rarely used; consider apps for SharePoint first).
    TipTip:
    Sandboxed solutions are deprecated in this release, so they are not the best option for custom code in the long term

Some customizations have very little risk or impact on your environment. Others have the potential for much higher risk and impact. The following table provides examples of different kinds of customizations, the risk level associated with that kind of customization, and potential issues that you might face if you allow that kind of customization.

Customizations

Risk level Types of customizations and examples Considerations or impact
Unsupported/High Unsupported customizations such as direct changes to the database schema or modifying files on the file system.
  • Will not be supported through Microsoft Customer Support.
  • Will be unable to upgrade.

Do not use.

Moderate to high Creating applications that interact with or redirect actions in key pipelines, such as events, claims, and so on.
  • Potential for service outage or performance issues.
  • Might require rework at upgrade.
Moderate to low Using a custom Web Part outside a sandbox environment, creating custom actions such as adding a menu item, or creating a custom site provisioning process.
  • Short or long-term performance issues or page errors.
  • Might require rework at upgrade.
Low Using solutions in a sandbox environment. Short-term performance issues; you can avoid some performance issues by using resource throttling and quotas.
Very low to no risk Using apps for SharePoint or using functionality within the product or configurations, such as associating a workflow with a list or using an instance of a built in Web Part. Minor configuration or page errors that would have to be addressed. Apps can be uninstalled or updated.
NoteNote:
For more information about customizations and upgrade, see Considerations for specific customizations.


Also, when you think through the customizations to allow in your environment, consider carefully whether a particular customization is necessary. If it recreates functionality that is already available in the product (such as creating a Web Part that does the same thing as the Content Editor Web Part or the Content by Query Web Part), then that might be unnecessary work.

Consider first whether the standard functionality can do what you want, or check the SharePoint Store to see if there is an app for SharePoint available that does what you need.

Follow these best practices to manage applications based on SharePoint 2013 throughout their life cycle:

  • Use separate development, preproduction, and production environments, and keep these environments as synchronized as possible so that you can accurately test your customizations.
  • Test all customizations before releasing the first time and after any updates have been made before you release them to your production environment.
  • Use source code control and solution and feature versioning to track changes to code.

Development, test, and production environments

Consistent branding with a corporate style guide makes for more cohesive-looking sites and easier development. Store approved themes in the theme gallery for consistency so that users will know when they visit the site that they are in the right place.

SharePoint 2013 includes a new feature to use for branding, Design Manager. By using Design Manager, you can create a visual design for your website with whatever web design tool or HTML editor you prefer and then upload that design into SharePoint. Design Manager is the central hub and interface where you manage all aspects of a custom design.

Creating the visual design of a site often fits into a larger process, in which multiple people or organizations are involved. For a roadmap of the tasks from a larger perspective, see Design and branding in SharePoint 2013.

SharePoint 2013 has a new development model based on apps for SharePoint. Apps for SharePoint are self-contained pieces of functionality that extend the capabilities of a SharePoint website. An app may include SharePoint features such as lists, workflows, and site pages, but it can also use a remote web application and remote data in SharePoint. An app has few or no dependencies on any other software on the device or platform where it is installed, other than what is built into the platform. Apps have no custom code that runs on the SharePoint servers.

The guidance for whether to use apps for SharePoint or SharePoint solutions is to:

  • Design apps for end users

    Apps for SharePoint:

    • Are easy for users (tenant administrators and site owners) to discover and install.
    • Use safe SharePoint extensions.
    • Provide the flexibility to develop future upgrades.
    • Can integrate with cloud-based resources.
    • Are available for both SharePoint Online and on-premises SharePoint sites.
  • Use farm solutions for administrators

    SharePoint solutions:

    • Can access the server-side object-model APIs that are needed to extend SharePoint management, configuration, and security
    • Can extend Central Administration, Windows PowerShell cmdlets, timer jobs, custom backups, and so on.
    • Are installed by administrators.
    • Can have farm, web application, or site-collection scope.

Go to MSDN to get more information about the new development model, Apps for SharePoint compared with SharePoint solutions, and Deciding between apps for SharePoint and SharePoint solutions.

Set a policy for using apps for SharePoint in your organization. Can users purchase and download apps? How do you make your organization’s apps available? How do you tell if they’re being used?

  • SharePoint Store   Determine whether users can purchase or download apps from the SharePoint Store.
  • App Catalog   Make specific apps for SharePoint available to your users by adding them to the App Catalog.
  • App requests   Configure app requests to control which apps are purchased and how many licenses are available.
  • Monitor apps   Monitor specific apps in SharePoint Server 2013 to check for errors and to track usage.

In the market

A look at : ALM and Lab Environments

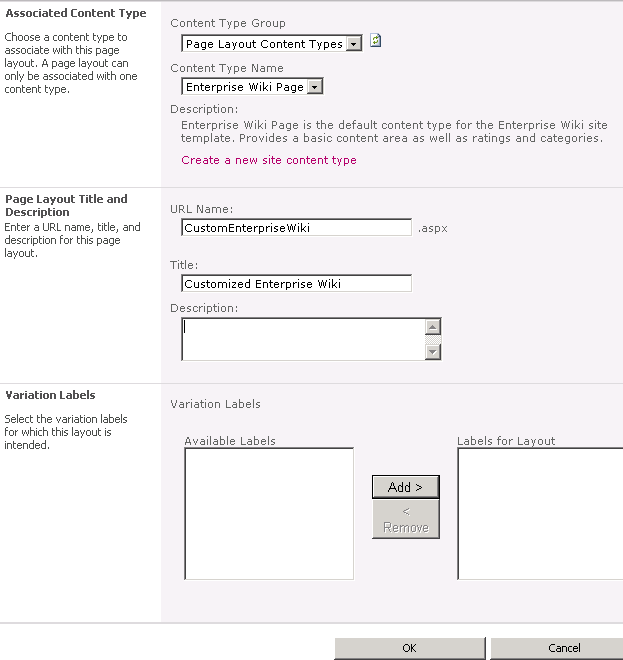
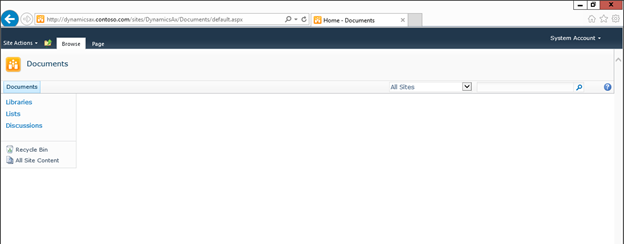
What is a lab environment?

A lab environment is a collection of computers that are managed as a single unit, and on which you deploy the system under test along with test software. Here is a typical configuration of machines in a lab environment:

JJ159341.75955053636946458F51D7F086CADE6D(en-us,PandP.10).png


Typical lab environment configuration

This one is set up for automated tests of an ice cream vending service. The software product itself consists of a web service that runs on Internet Information Services (IIS) and a database that runs on a separate machine. The tests drive a web browser on a client machine.

With a lab environment, you can run a build-deploy-test workflow in which you can automatically build your system, deploy its components to the appropriate machines in the environment, run the tests, and collect test data. (The fully automated version of this is described in Chapter 5, “Automating System Tests.”)

The workflow is controlled by a test controller with the help of test agents installed on each test machine. The test controller runs on a separate computer.

Now you might ask why you need lab environments, since you could deploy your system and tests to any machines you choose.

Well, you could, but lab environments make several things easier:

  • You can set up automated build-deploy-test workflows. The scripts in the workflow use the lab role names of the machines, such as “Web Client,” so that they are independent of the domain names of the computers.
  • The results of tests can be shown on charts that relate them to requirements.
  • Lab Manager automatically installs test agents on each machine, enabling test data to be collected. Lab Manager manages the test settings of the virtual environment, which define what data to collect.
  • You can view the consoles of the machines through a single viewer, switching easily from one machine to the other.
  • Lab environments manage the allocation of machines to tests for reasons that include preventing two team members from mistakenly assigning the same machine to different tests.

Lab environments come in two varieties. A standard lab environment (roughly equivalent to a physical environment in Visual Studio 2010) can be composed of any computers that you have available, such as physical computers or virtual machines running on third-party frameworks.

An SCVMM environment is made up entirely of virtual machines controlled by System Center Virtual Machine Manager (SCVMM). SCVMM environments provide you with several valuable facilities; they allow you to:

  • Create fresh test environments within minutes. You can store a complete environment in a library and deploy running copies of it. For example, you could store an environment of three machines containing a web client, a web server, and a database. Whenever you want to test a system in that configuration, you deploy and run a new instance of it.
  • Take snapshots of the states of the machines. For example whenever you start a test, you can revert to a snapshot that you took when everything was freshly installed. Also, when you find a bug, you can take a snapshot of the environment for later investigation.
  • Pause and resume all the virtual machines in the environment at the same time.

Standard environments are useful for tests that have to run on real hardware, such as some kinds of performance tests. You can also use them if you haven’t installed SCVMM or Hyper-V, as would be the case if, for example, you already use another virtualization framework. But as you can see, we think there are great benefits to using SCVMM environments.

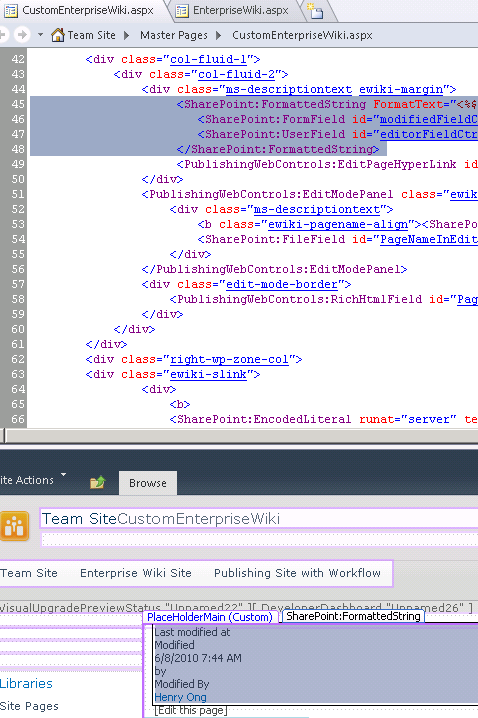
Stored SCVMM environments

Because you can store them in a library, SCVMM environments help to make your tests repeatable; when you run them for the next build, or when a new release is planned after a six-month break, you can be sure that the tests are running under the same conditions.

JJ159341.94F2E0510A25C5D3BB02389020654B0D(en-us,PandP.10).png


A stored SCVMM environment

For example, on Fabrikam’s ice cream sales project, the team often wants to deploy and test a new build of the sales system. It has several components that have to be installed on different machines. Of course, the sales system software is a new build each time. But the platform software, such as operating system, database, and web browser don’t change.

So at the start of the project, the team creates an environment that has the platform software, but no installation of the ice cream system. In addition, each machine has a test agent. The Fabrikam team stores this environment in the library as a template.

Whenever a new build is to be tested, a team member selects the stored platform environment, and chooses Deploy. Lab Manager takes a few minutes to copy and start the environment. Then they only have to install the latest build of the system under test.

While an environment is running, its machines execute on one or more virtualization hosts that have been set up by the system administrator. The stored version from which new copies can be deployed is stored on an SCVMM library server.

Lab management with third-party virtualization frameworks

Some teams have already invested in other virtualization frameworks such as VMware or Citrix XenServer. If that is your situation, the case for switching to Hyper-V and SCVMM might be less clear. But even if you don’t install SCVMM or Hyper-V, you can still use Lab Manager by using standard environments.

With standard environments, you get many of the benefits of lab management, but without the ability to save and quickly set up fresh environments. Instead, you’d have to use your third-party machine manager to set up new machines.

When you assign a machine to a standard environment, Lab Manager will automatically install a test agent and couple it to your test controller. This makes the machine ready for an automatic build-deploy-test workflow and for test data collection. (In Visual Studio 2010, you have to install the test agent manually, but coupling it to the test controller is automatic.)

How to use lab environments

Prerequisites

To enable your team to use lab environments, you first have to set up:

  • Visual Studio Team Foundation Server, with the Lab Manager feature enabled.
  • A test controller, linked to your team project in Team Foundation Server.
  • (Preferable, but not mandatory) System Center Virtual Machine Manager (SCVMM) and Hyper-V.

You only need to set up these things once for the whole team, so we have put the details in the Appendix. If someone else has kindly set up SCVMM, Lab Manager, and a test controller, just continue on here.
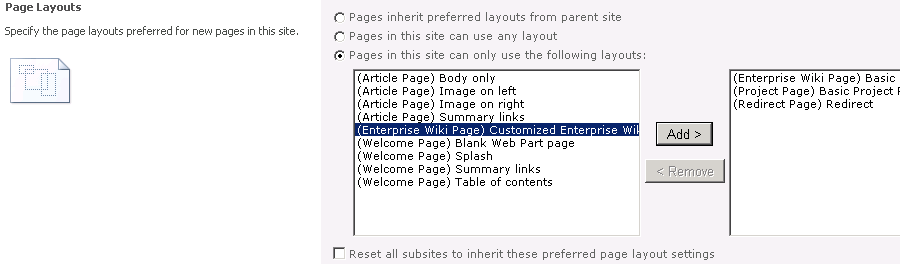
Lab center

You manage environments by using Lab Center, which is part of Microsoft Test Manager (MTM). MTM is installed as part of Visual Studio Ultimate or Test Professional. You’ll find it on the Windows Start menu under Visual Studio. If it’s your first time using it, you’ll be asked for the URL of your team project collection. Switch to the Lab Center view (it’s the alternative to Test Center). On the Environments page, you’ll see a list of environments that are in use by your team. Some of them might be marked “in use” by individual team members:

JJ159341.C0DD8E47801E316B77E376F020E16388(en-us,PandP.10).png


Managing environments in Lab Center

(Use the Home button if you want to switch to another team project.)

More information is available from the MSDN website topic: Getting Started with Lab Management.

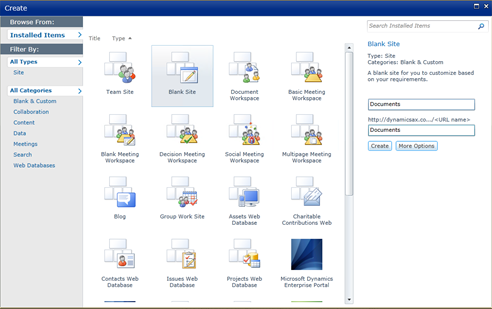
Connecting to a lab environment

If your team has been using lab environments for a while, then when you open Lab Center, you might already see some environments that are available to use. Pick an environment with a status of Ready, without an In Use flag, and that looks as if it has the characteristics you want, which ought to be indicated by its name. Select it and choose Connect.

The Environment View opens. From here you can log into any of the machines in the environment.

JJ159341.551E17E6D88750A24E53C143E0C6CB73(en-us,PandP.10).png


The environment view

Typically, a deployed environment will have a recent build of your system already installed. If you’re sure that it’s free for you to use, you could decide to run some tests on it. However, make sure you know your team’s conventions; for example, if the environment’s name contains the name of a team member, ask if it is ok to use.

Using a deployed (running) environment

Log in. Choose the Connect button to open a console view of the environment. From there you can log into any of its machines. More about the Connect button can be found on MSDN in the topic How to: Connect to a Virtual Environment.

Reserve the environment. You can mark it as In Useto discourage other team members from interfering with it. This doesn’t prevent access by others, but simply sets a flag in Lab Center.

Revert a virtual environment to a clean snapshot. In the environment viewer, look at the Snapshots tab. If the Snapshots tab isn’t available, then this is a standard environment composed of existing machines. You might need to make sure that the latest version of your system is installed.

In a virtual environment, the team member who created the environment should have made a snapshot immediately after installing the system under test. Select the snapshot and restore the environment to that state. If there isn’t a snapshot available, that’s (hopefully) because the previous user has already restored it to the clean state. Again, you might need to check the conventions of your team.

Explore and test your system. Now you can start testing your system, which is the topic of the next chapter.

Restore the snapshot when you’re done with a virtual environment, to restore it to the newly installed state. This makes it easier for other team members to use. This option isn’t available for standard environments, so you might want to clean up any test materials that you have created.

Clear the “in use” flag when you’re done.Typically, a team will keep a number of running environments that contain a recent build, and share them. Reusing the environment and restoring it to its initial snapshot is the quickest way of assigning an environment for a test run.

Deploying an environment

If there is no running environment that is suitable for what you want to do, you can look for one in the library. The library contains a selection of stored virtual environments that have previously been created by your colleagues. You can learn more from the topic: Using a Virtual Lab for Your Application Lifecycle, on MSDN.

JJ159341.DDEFBF57250131604C3C6FD0605EAC74(en-us,PandP.10).png


The environment library in MTM Lab Center

(If the library isn’t available, that might mean that your team has not set Lab Manager to use SCVMM. But you can still create standard environments, which are made up of computers not controlled by SCVMM. Skip to the section about them near the end of this chapter. Alternatively, you could set up SCVMM as we describe in the Appendix.)

Environments stored in the library are templates; you can’t connect to one because its virtual machines aren’t running. Instead, you must first deploy it. Deploying copies the virtual machines from the library to the virtual machine host, and then starts them.

In MTM, in Lab Center, choose Deploy. Choose an environment from the list. They should have names that help you decide which one you want.

After you have picked an environment, Lab Center takes a few minutes to copy the virtual machines and to make sure that the test agents (which help deploy software and collect data) are running.

Eventually the environment is listed under the Lab tab as Ready (or Running in Visual Studio 2010). Then you’re all set to use it. If it shows up as Not Ready, then try the Repair command. This reinstalls test agents and reconnects them to your test controller. In most cases that fixes it.

Install your system

Typically, stored environments contain installations of the base platform: operating systems, databases, and so on. They don’t usually include an installation of the system under test. Your next step is therefore to install the latest build of your system.

To help choose a good recent build, open the build status report in your web browser. The URL is similar to http://contoso-tfs:8080/tfs/web. Click on Builds. You might have to set the date and other filters. The quality and location of each build is summarized.

In Lab Center, under the Lab tab, select the running environment and choose Connect. Log into the environment’s machines.

Use the installer (typically an .msi file) that is generated by the build process. The location can be obtained from the build status reports. Pick an installer that was generated from the Debug build configuration. You need to put each component on the right machine. Each machine has a role name such as Client, Web Server, or Database, to help you make the right choice.

Later we’ll discuss how you can write scripts to automate the deployment of the system under test.

Review the name you gave to the environment to make sure it reflects the system and build you installed.

Take a snapshot of the environment

Create a snapshot of the environment. This will enable subsequent users to get the environment back to its nice clean state. Do this immediately after you have installed your system, and before you run any tests, other than perhaps a quick smoke test to make sure the installation is OK.

You can create a snapshot either from the Snapshots tab in Environment Viewer, or from the context menu of the environment in the Lab listing.

Use it

After you’ve taken a snapshot, you can start using it as we described earlier. When you’ve finished testing, you can revert to the snapshot.

Delete it (eventually)

Delete an environment when the build it uses is superseded.

Creating a new virtual environment

What if there are no environments in the stored library, or none have the mix of machines you need? Then you’ll have to create one. And if you’re feeling generous, you could add it to the library for other team members to use.

You can either store an environment directly in the library, or you can create it as a running environment and then store it in the library. Storing directly is preferable if you don’t need to configure the constituent virtual machines in any way.

To add a new environment directly to the library, open MTM; choose Lab Center, Library, Environments, and then the New command.

Follow link to expand image


Creating a new environment in the library

Alternatively, to create a new running environment that you can store later, choose Lab Center, Lab, and then New. In the wizard, choose SCVMM Environment. (In Visual Studio 2010, the New command has a submenu, New Virtual Environment.)

In either method, you continue through the wizard to choose virtual machines from the library. If your team has been working for a while, there should be a good stock of virtual machines. Their names should indicate what software is installed on them.

Choose library machines that have type Template if they are available. Unlike a plain virtual machine, you can deploy more than one copy of a template. This is because when a template VM is deployed, it gets a new ID so that there are no naming conflicts on your network. Using templates to create a stored environment allows more than one copy of it to be deployed at a time.

JJ159341.11F88DD461E5D5629797A0A64190C808(en-us,PandP.10).png


Creating a new virtual environment

You have to name each machine uniquely within your new lab environment. Notice that the name of the computer in the environment is not automatically the same as its name in the domain or workgroup.

You also have to assign a role name to each machine, such as Desktop Client or Web Server. More than one machine can have the same role name. There is a predefined set to choose from, but you can also invent your own role names. These roles are used to help deploy the correct software to each machine. If you automate the deployment process, you will use these names; if you deploy manually, they will just help you remember which machine you intended for each software component.

When you complete the wizard, there will be a few minutes’ wait while VMs are copied.

MTM should now show that your environment is in the library, or that it is already deployed as a running environment, depending on what method of creation you chose to begin with. If it’s in the library, you can deploy it as we described before.

After creating an environment, you typically deploy software components and then keep the environment in existence until you want to move to a new build. Different team members might use it, or you might keep it to yourself. You can mark an environment as “In Use” to discourage others from interfering with it while your work is in progress.

Stored and running machines

The lab manager library can store both individual virtual machines and complete environments. There are command buttons for creating new environments, storing them in the library, and for deploying environments from the library. You have to shut down an environment before you can store it.

JJ159341.915E41C06D69548CC8AE9616387F13A5(en-us,PandP.10).png


Stored and deployed environments

Creating and importing virtual machines

You can store individual virtual machines from the test host to the library. Therefore, if your team starts off with a set of virtual machines in the library that include a basic set of platforms—for example, Windows 7 and Windows Server 2008—then you can deploy a machine in an environment, add extra bits, and then store it back in the library.

JJ159341.50A8846DD943403543185DF65F8DC37E(en-us,PandP.10).png


System Center Virtual Machine Manager (SCVMM)

But how do you create those first virtual machines? For this you need to access SCVMM, on which Lab Manager is based. It’s typically an administrator’s task, so you’ll find those details in the Appendix. Briefly:

  1. You can create a new machine in the SCVMM console and then install an operating system on it, either with your DVD or from your corporate PXE server.
  2. Every test machine needs a copy of the Team Foundation Server Test Agent, which you can get from the Team Foundation Server installation DVD.
  3. Use the SCVMM console to store the VM in the library as a template. This is preferable to storing it as a plain VM.
  4. In Lab Manager, use the Import command on the Library tab in order to make the SCVMM library items visible in the Lab Center library.

JJ159341.84682E4E4DA4A8940F44677579E69D0A(en-us,PandP.10).png


How environments are managed

Composed environments

A composed environment is made up of virtual machines that are already running. When you compose an environment from running machines, they are assigned to your environment; when you delete the environment, they are returned to the available pool. You can create a composed environment very quickly because there is no copying of virtual machines.

We recommend composed environments for quick exploratory tests of a recent build. The team should periodically place new machines in the pool on which a recent build is installed. Team members should remember to delete composed environments when they are no longer using them.

JJ159341.B7D97B097F6BCBF97980D943DEF5EEA8(en-us,PandP.10).png


Composed environments

In Visual Studio 2012, you make a composed environment the same way you create a virtual environment: by choosing New and then SCVMM environment. In the wizard, you’ll see that the list of available machines includes both VM templates and running pool machines. If you want, you can mix pool machines and freshly created VMs both in the same environment. For example, you might use new VMs for your system under test, and a pool machine for a database of test data, or a fake of an external system. Because the external system doesn’t change, there is no need to keep creating new versions of it.

In Visual Studio 2010, use the New Composed Environment command and choose machines from the list.

Standard environments

Standard environments are made up of existing computers. They can be either physical or virtual machines, or a mixture. They must be domain-joined.

You can create standard environments even if your team hasn’t yet set up SCVMM. For example, if you are already using VMware to run virtual machines and don’t want to switch to Hyper-V and SCVMM, you can use Lab Manager to set up standard environments. You can’t stop, start, or take snapshots of standard environments, but Lab Manager will install test agents on them and you can use them to run a build-deploy-test workflow.

You can also use standard environments when it is important to use a real machine—for example, in performance tests.

To create a standard environment, click New and then choose Standard Environment.

(In Visual Studio 2010, choose New Physical Environment. You must manually install test and lab agents on the computers. These agents can be installed from the Team Foundation Server DVD.)

For an example, see Lab Management walkthrough using Visual Studio 11 Developer Preview Virtual Machine on the Visual Studio Lab Management team blog.

Summary

There’s a lot of pain and overhead in configuring physical boxes to build test environments. The task is made much easier by Visual Studio Lab Manager, particularly if you use virtual environments.

With Lab Manager you can:

  • Manage the allocation of lab machines, grouping them into lab environments.
  • Configure machines for the collection of test data.
  • Rapidly create fresh virtual environments already set up with a base platform of operating system, database, and so on.

Differences between Visual Studio 2010 and Visual Studio 2012

  • System Center Virtual Machine Manager 2012. Lab Management in Visual Studio 2012 works with SCVMM 2012 in addition to SCVMM 2008.
  • Standard environments. Lab Manager in Visual Studio 2012 is easier to use with third-party virtualization frameworks as well as physical computers. It will install test agents if necessary.
  • Test agents. In Visual Studio 2010, you must install test and lab agents on the machines that you want to use in the lab. In Visual Studio 2012, there is only one type of agent, and it is installed automatically by Lab Manager on each of the machines in a lab environment. You can still install the test agent yourself to save time when lab environments are created.
  • Compatibility. Most combinations of 2010 and 2012 RC products work together. For example, you can create environments on Visual Studio Team Foundation Server 2010 using Microsoft Test Manager 2012 RC.

JJ159341.133AB26540FC407EBE448F1A9C7558A7(en-us,PandP.10).png

A Look At : Visual Studio Codelens

A Visual Studio Full of Panels

Let’s say you’re looking at a code file, specifically a method.  Your Visual Studio environment may look like this:

image

I’m looking at the second Create method (the one that takes a Customer).  If I want to know where this method may be referenced, I can “Find All References”, either by selecting it from the context menu, or using Shift + F12. Now I have this:

image

Great!  Now, if I decide to change this code, will it will work?  Will my tests still work?  In order for me to figure that out, I need open my Test Explorer window.

image

Which gives me a slightly more cluttered VS environment:

image

(Now I can see my tests, but I still need to try and identify which tests actually exercise my method.)

Another great point of context to have is knowing if I’m looking at the latest version of my code.  I’d hate to make changes to an out-of-date version and grant myself a merge condition.  So next I need to see the history of the file.

image

Cluttering my environment even more (because I don’t want to take my eyes of my code, I need to snap it somewhere else), I get this:

image

Okay, time out.

Yes, this looks pretty cluttered, but I can organize my panels better, right?  I can move some panels to a second monitor if I want, right?  Right on both counts.  By doing so, I can get a multi-faceted view of the code I’m looking at.  However, what if I start looking at another method, or another file?  The “context” of those other panels don’t follow what I’m doing.  Therefore, if I open the EmployeesController.cs file, my “views” are out of sync!

image

That’s not fun.

A Visual Studio Full of Context

So all of the above illustrates two main benefits of something like CodeLens.  CodeLens inserts easy, powerful, at-a-glance context for the code your looking at.  If it’s not turned on, do so in Options:

image

While you’re there, look at all the information it’s going to give you!

Once you’ve enabled CodeLens, let’s reset to the top of our scenario and see what we have:

image

Notice an “overlay” line of text above each method.  That’s CodeLens in action. Each piece of information is called a CodeLens Indicator, and provides specific contextual information about the code you’re looking at.  Let’s look more closely.

image

References

image

References shows you exactly that – references to this method of code.  Click on that indicator and you can see and do some terrific things:

image

It shows you the references to this method, where those references are, and even allows you to display those references on a Code Map:

image

Tests

image

As you can imagine, this shows you tests for this method.  This is extremely helpful in understanding the viability of a code change.  This indicator lets you view the tests for this method, interrogate them, as well as run them.

image

As an example, if I double-click the failing test, it will open the test for me.  In that file, CodeLens will inform me of the error:

image

Dramatic pause: This CodeLens indicator is tremendously valuable in a TDD (Test Driven Development). Imagine sitting your test file and code file side-by-side, turning on “Run Tests After Build”, and using the CodeLens indicator to get immediate feedback about your progress.

Authors

image

This indicator gives you very similar information as the next one, but list the authors of this method for at-a-glance context.  Note that the latest author is the one noted in the CodeLens overlay.  Clicking on this indicator provides several options, which I’ll explain in the next section.

image

Changes

image

The Changes indicator tells you information about the history of the file at it exists in TFS, specifically Changesets.  First, the overlay tells you how many recent changes there are to this method in the current working branch.  Second, if you click on the indicator you’ll see there are several valuable actions you can take right from that context:

image

What are we looking at?

  • Recent check-in history of the file, including Changeset ID, Branch, Changeset comments, Changeset author, and Date/time.
  • Status of my file compared to history (notice the blue “Local Version” tag telling me that my code is 1 version behind current).
  • Branch icons tell me where each change came from (current/parent/child/peer branch, farther branch, or merge from parent/child/unrelated (baseless)).

Right-clicking on a version of the file gives you additional options:

image

  • I can compare my working/local version against the selected version
  • I can open the full details of the Changeset
  • I can track the Changeset visually
  • I can get a specific version of the file
  • I can even email the author of that version of the file
  • (Not shown) If I’m using Lync, I can also collaborate with the author via IM, video, etc.

This is a heck of a lot easier way to understand the churn or velocity of this code.

Incoming Changes

image

The Incoming Changes indicator was added in 2013 Update 2, and gives you a heads up about changes occurring in other branches by other developers.  Clicking on it gives you information like:

image

Selecting the Changeset gives you the same options as the Authors and Changes indicators.

This indicator has a strong moral for anyone who’s ever been burned by having to merge a bunch of stuff as part of a forward or reverse integration exercise:  If you see an incoming change, check in first!

Work Items (Bugs, Work Items, Code Reviews)

image

I’m lumping these last indicators together because they are effectively filtered views of the same larger content: work items.  Each of these indicators give you information about work items linked to the code in TFS.

image

image

Knowing if/when there were code reviews performed, tasks or bugs linked, etc., provides fantastic insight about how the code came to be.  It answers the “how” and “why” of the code’s current incarnation.


A couple final notes:

  • The indicators are cached so they don’t put unnecessary load on your machine.  As such they are scheduled to refresh at specific intervals.  If you don’t want to wait, you can refresh the indicators yourself by right-clicking the indicators and choosing “Refresh CodeLens Team Indicators”

image

  • There is an additional CodeLens indicator in the Visual Studio Gallery – the Code Health Indicator. It gives method maintainability numbers so you can see how your changes are affecting the overall maintainability of your code.
  • You can dock the CodeLens indicators as well – just know that if they dock, they act like other panels and will be static.  This means you’ll have to refresh them manually (this probably applies most to the References indicator).
  • If you want to adjust the font colors and sizes (perhaps to save screen real estate), you can do so in Tools –> Options –> Fonts and Colors.  Choose “Show settings for” and set it to “CodeLens”.

HTML5 SharePoint Pic Web Part Released and Available !!

This is a Sandbox web part control to display a matrix of image thumbnails.

For a build a Metro IDE or a Picture Gallery to show products, news, or a social team that integrates with pictures, etc. All this, from any SharePoint picture library.

Supports : SharePoint 2010 & 2013 On-Premise Web Part,  SharePoint Online Web Part

FEATURES OF THE WEB PART** ver. 1.0


**PREVIEW EXAMPLE OF THE CONTROL**


1

How To : Design the Physical Architecture to Support Collaborative Development and ALM of SharePoint Foundation 2010 Application

Introduction

This article explains the physical architecture which fits best in collaborative development and ALM of SharePoint Foundation 2010 application and what are the servers and tools needed and how they play key roles in ALM of SharePoint Foundation 2010. The purpose of this article is to provide overall understanding of various servers and farms connected to each other in SharePoint Foundation.

Background

Basic understanding of different server OS & SharePoint Foundation 2010 is required.

Solution

Application Life-cycle Management (ALM) is the co-ordination of development life-cycle activities—including requirements, modeling, development, build, and testing. Recently, ALM has expanded beyond the application and the software development life cycle to also include business solution governance, infrastructure management, operations, and support.

You can use ALM to help align your organization in the context of a software solution in business, development, and operations. With an application development platform that supports ALM, you can provide integration between the various tools used and activities performed within each of these capabilities.

There are main four types of staging servers with standalone developer’s environment which plays a key role in ALM of SharePoint 2010 application:

  1. Development SharePoint Farm
  2. Team foundation server
  3. Integration/Testing Farm
  4. Production Farm
    +
    Developer’s Workstation

The below figure is a physical architecture which depicts how each sever is interconnected to support collaborative development and ALM for SharePoint Foundation 2010 application:

Click to enlarge image

Development SharePoint Farm

A SharePoint farm is fundamentally a collection of SharePoint role servers that provide for the base infrastructure required to house SharePoint sites. The farm level is the highest level of SharePoint architecture, providing a distinct operational boundary for a SharePoint environment. Each farm in an environment is a self-encompassing unit made up of one or more servers, such as web servers, service application servers, and SharePoint database servers.

SharePoint development farm needed for the developers in an organization that makes heavy use of SharePoint often need environments to test new applications, web parts, solutions, and other SharePoint customization. These developers often need a sandbox area where these farm level features and solutions can be tested.

I have considered two-tier topology for SharePoint Foundation 2010 farm. However it will be entirely based on the need of your application. If your application is a relatively small intranet application, then you can choose single tier topology or if you are going to integrate other search server with foundation, then you can choose three-tier topology with application server as a middle tier (Remember that SharePoint Foundation 2010 doesn’t include enterprise search). It may make sense to deploy one or more development farms so that developers have the opportunity to run their tests and develop software for SharePoint independent of the existing production environment.

There are basically two types of servers included in two-tier development farm of SharePoint Foundation 2010:

  1. Web server
  2. Content database server

In the above figure, there are three front-end web servers and one SharePoint content database server. However you can choose a single front-end web server connected to content database server based on your application need and architecture of production environment. All web servers share the same content database. This is called two-tier deployment farm where SharePoint server component and content database are installed on separate server. As I mentioned before, you can choose one-tier, two-tier or three-tier deployment topology based on your application architecture and topology of production architecture.

Each web server has SharePoint Foundation 2010 and SharePoint extension for TFS 2010 install on it. It needs SharePoint extension for TFS 2010 to connect with Team Foundation Server for source control, build management & project management.

Advantage of Development SharePoint Farm:

  1. Single place where SharePoint Admin can integrate all the final artifacts from multiple developers.
  2. Developer can sync with latest SharePoint site on its standalone developer workstation.
  3. Admin can easily approve artifacts and migrate to integration server.
  4. It is a unit testing environment for developers where they can test dependent functionality or farm level features.

Team Foundation Server

Team Foundation Server plays a key role in ALM which provides source control, build management and work item. You can have TFS installed on the same server which has content database server but if you are going to use build management of TFS, then it is advisable to have separate Team Foundation Server because it utilizes CPU intensively when it processes the builds.

As per the above figure, there are separate Team foundation servers which are connected to SharePoint Farm as well as standalone development workstation so that it can provide source control for customized content as well as developer’s artifacts and resources.

Advantages of TFS
  1. Source control for SharePoint artifacts and customization
  2. Build management for SharePoint
  3. Work item and bug tracking tool for SharePoint
  4. Admin console for all management activity
  5. Easy integration with SharePoint foundation server and VS 2010
  6. Easy check-in & check-out
  7. Web based console to manage ALM activity

Developer’s Workstation

As per the above figure, developers’ environment includes two developers workstation. In practice, you can take as many workstations as your development team size.

Developer workstation should have Windows 7 or Windows vista operating system with standalone SharePoint foundation server with local content database. So that one developer’s work doesn’t affect another developer and he can debug artifacts locally.

Developer workstation will include the following stuff installed:

  1. Windows 7 or Windows vista 64 bit OS
  2. Stand alone SharePoint Foundation server 2010
  3. SharePoint designer 2010
  4. Visual Studio 2010 (connected to TFS)

Developer workstation should be connected to Team Foundation Server 2010 so that when developer finally completes his artifact, then he can check-in his artifact in TFS so that other developers can take the latest code from TFS if needed. This way, parallel development can happen without affecting other developer’s work.

Integration/Testing Farm

Any production SharePoint environment should have a test environment in which new SharePoint web parts, solutions, service packs, patches, and add-ons can be tested. It is critical to deploy test farms, because many SharePoint add-ons could potentially disrupt or corrupt the formatting or structure of a production environment, and trying to test these new solutions on site collections or different web applications is not enough because the solutions often install directly on the SharePoint servers themselves. If there is an issue, the issue will be reflected in the entire farm.

Integration or testing server farm should be similar to the existing environments, with the same add-ons and solutions installed and should ideally include restores of production site collections to make it as similar as possible to the existing production environment. All changes and new products or solutions installed into an environment should subsequently be tested first in this environment.

Integration/testing servers will have final SharePoint sites and site collection as per the business requirements. QA will test all the business functionality here. Customer can also do their ‘User acceptance test’ before going live to the production server.

After user acceptance test passed, all the sites & site collection will be deployed on production server.

Advantage of Integration testing server:

  1. Clean environments and same physical architecture as production
  2. QA can test all dependent business functionality at one place
  3. Customer can participate in UAT
  4. Easy deployment/migration from integration testing server to production server

Production Farm

The final stage is rolling your farm into a production environment. At this stage, you will have incorporated the necessary solution and infrastructure adjustments that were identified during the user acceptance test stage. These servers are generally in the customer’s premises. Development team and testing team do not have control over it.

There are various 3rd party tools available in the market for SharePoint data protection, administration, migration, compliance and integration.

ImageGen[1]

Summary

So this way, you can design physical architecture where Development SharePoint Farm and developer’s workstation are integrated with TFS 2010. TFS and Content database are connected to testing server or testing farm where all the artifacts and content will be integrated in testing server for QA and UAT. Finally after UAT, it will be deployed on production farm.

You can use VM (Virtual Machine) for all the servers and workstation for effective infrastructure because if server crashes due to some reason, then you can quickly create a new VM for the needed OS from images.

Note: In the above figure, integration/Testing farm and production farm is a single server just for clear understanding but it will be as large as development farm with number of front-end web server and content database server in reality. All the server OS is Windows Server 2008 R2 SP2 64 bit. Please visit here for more information on hardware & software requirements for SharePoint Foundation 2010.

How Microsoft’s Research Team is making Testing and the use of Pex & Moles Fun and Interesting

Try it out on the web

Go to www.pex4fun.com, and click Learn to start tutorials.

Main Publication to cite

Nikolai Tillmann, Jonathan De Halleux, Tao Xie, Sumit Gulwani, and Judith Bishop, Teaching and Learning Programming and Software Engineering via Interactive Gaming, in Proc. 35th International Conference on Software Engineering (ICSE 2013), Software Engineering Education (SEE), May 2013


Massive Open Online Courses (MOOCs) have recently gained high popularity among various universities and even in global societies. A critical factor for their success in teaching and learning effectiveness is assignment grading. Traditional ways of assignment grading are not scalable and do not give timely or interactive feedback to students.


To address these issues, we present an interactive-gaming-based teaching and learning platform called Pex4Fun. Pex4Fun is a browser-based teaching and learning environment targeting teachers and students for introductory to advanced programming or software engineering courses. At the core of the platform is an automated grading engine based on symbolic execution.


In Pex4Fun, teachers can create virtual classrooms, customize existing courses, and publish new learning material including learning games. Pex4Fun was released to the public in June 2010 and since then the number of attempts made by users to solve games has reached over one million.


Our work on Pex4Fun illustrates that a sophisticated software engineering technique – automated test generation – can be successfully used to underpin automatic grading in an online programming system that can scale to hundreds of thousands of users.


Code Hunt is an educational coding game.

Play win levels, earn points!

Analyze with the capture code button

Code Hunt is a game! The player, the code hunter, has to discover missing code fragments. The player wins points for each level won with extra bonus for elegant solutions.

Code in Java or C#

Discover a code fragment

Play in Java or C#… or in both! Code Hunt allows you to play in those two curly-brace languages. Code Hunt provides a rich editing experience with syntax coloring, squiggles, search and keyboard shortcuts.

Learn algorithms

Discover a code fragment

As players progresses the sectors, they learn about arithmetic operators, conditional statements, loops, strings, search algorithms and more. Code Hunt is a great tool to build or sharpen your algorithm skills. Starting from simple problems, Code Hunt provides fun for the most skilled coders.

Graded for correctness and quality

Modify the code to match the code fragment

At the core of the game experience is an automated grading engine based on dynamic symbolic execution. The grading engine automatically analyzes the user code and the secret code to generate the result table.

MOOCs with Office Mix

Add Code Hunt to your presentations

Code Hunt can included in any PowerPoint presentation and publish as an Office Mix Online Lesson. Use this PowerPoint template to create Code Hunt-themed presentations.

Web no installs, it just works

It just works

Code Hunt runs in most modern browsers including Internet Explorer 10, 11 and recent versions of Chrome and Firefox. Yup, it works on iPad.

Extras play your own levels

Play your own levels

Extra Zones with new sectors and levels can be created and reused. Read designer usage manual to create your own zone.

Compete so you think you can code

Compete

Code Hunt can be used to run small scale or large scale, private or public, coding competition. Each competition gets its own set of sectors and levels and its own leaderboard to determine the outcome. Please contact codehunt@microsoft.com for more information about running your own competition using Code Hunt.

Credits the team

Capture the working code fragment

Code Hunt was developed by the Research in Software Engineering (RiSE) group and Connections group at Microsoft Research. Go to our Microsoft Research page to find a list of publications around Code Hunt.

A Look At : Visual Studio 2013 Update 3 CTP2

avatar[2]

New technology improvements in Visual Studio 2013 Update 3 CTP 2


Technology improvements

The following technology improvements were made in this release.

CodeLens

  • CodeLens jobs that are running on the Team Foundation Server job agent have been optimized for performance specifically while processing branching and merging changesets.

Debugger

  • If you have more than one monitor, Visual Studio will remember which monitor a Windows Store application was last run on.
  • You can debug x86 applications that are built by .NET native.
  • When you analyze managed memory dump files, you can go to Definition and Find All References of the selected type.
  • You can debug the dump files from .NET Native applications by using Visual Studio debugger.

General

  • The Application Insights Tools for Visual Studio are now included in Visual Studio 2013 Update 3 CTP2. This initial integration as part of CTP2 includes some software updates and performance improvements.

IntelliTrace

  • You can skip straight to the details of performance events that are exported from Application Insights to IntelliTrace.

Profiler

  • The Performance and Diagnostics hub can open profiling sessions (.diagsession files) that were exported from the F12 tools in the latest developer preview of Internet Explorer 11.
  • Windows Presentation Foundation (WPF) and Win32 applications are supported by the new Memory Usage Tool in the Performance and Diagnostics Hub. For more information about how to use the tool to troubleshoot issues in native and managed memory, go to the following blog post:
    Diagnosing memory issues with the new Memory Usage Tool in Visual Studio

Release Management

  • You can useWindowsPowerShell or theWindowsPowerShell Desired State Configuration (DSC) feature to deploy and manage configuration data. Additionally, you can deploy to the following environments without having to set up Microsoft Deployment Agent:
    • Microsoft Azure environments
    • On-premise environments (Standard environments)

Testing Tools

  • You can add custom fields and custom work flows for test plans and test suites.
  • You can use Manage Test Suites permission for granting access to test suites.
  • You can track changes to test plans and test suites by using work item history.

For more information about these features, see the following Visual Studio Developer Tools blog article:

Test Plan and Test Suite Customization with TFS2013 Update3

Visual Studio IDE

  • CodeLens authors and changes indicators are now available for Git repositories.
  • In Code Map, links are styled by using colors, and they display in the improved Legend.
  • Debugger Map automatically zooms to the call stack entry of interest and preserves user’s zoom preferences.
  • You can drag binaries from the Windows file explorer to a code map, and then start exploring binaries by using Code Map.

Known issues

Testing Tools

  • When you try to upgrade an existing TFS server that has Test management data to Visual Studio 2013 Team Foundation Server Update 3 CTP2 in JPN or CHS, the upgrade of Test Case Management service does not work.

Visual Studio IDE

  • In Visual Studio 2013 Ultimate Update 3 CTP2 localized (non en-us) drops, when trying to request a Code Map, or a Dependency Graph for the solution, the directed graph is not produced.


For more information on Visual Studio 2013 and other upgrades, visit http://support.microsoft.com/kb/2933779/en-us

Creating Your Own Document Management System With SharePoint and Dynamix

Image

With the R2 release of Dynamics AX 2012, a new feature was quietly snuck into the product that allows you to store document attachments from Dynamics AX within SharePoint rather than within an archive location, or within the database. This opens up a whole slew of possibilities when it comes to document management within SharePoint.

In this example we will show how you can create a document management structure within SharePoint that you can use in conjunction with the Dynamics AX attachments feature, and also we will show a few tweaks that you can make that may make managing your documents within SharePoint just a little easier.

Creating a new Document Management Site

The first step that we are going to work through is the creation of a new Document Management site where we will put all of our Dynamics AX document attachments. We are just creating a site to separate out the documents from other items that you may already have stored within SharePoint.

How to do it…

To create a new Document Management Site in SharePoint, follow these steps:

  1. Open up the SharePoint Workspace that you want to use to house your Document Management site and from the Site Actions menu, select the New Site option.
  2. When the Site Templates are displayed, select the Blank Site template. Give your site a name, and also a sub site name (probably the same as your site name). When you are done, click on the Create button for start the site creation process.

How it works…

When the site is created, you should be taken to a new blank site which you will be able to use as a document repository.

Creating Document Libraries for the Business Areas

The next step in the process is to create document libraries to store all of your documents away in. You could create one big library, or a number of smaller ones, broken out into groups based on business area or function. In this example we will do the latter because it will give us more flexibility with the indexing of the documents, and also make it easier to find particular documents.

How to do it…

To create document libraries for the business areas, follow these steps:

  1. From within your new Document Management site, select the New Document Library option from the Site Actions menu.
  2. When the Document Library Creation dialog box appears, give your library a Name, Description, and also set the Document Template to None. In this example we are creating a library for all of the AP Documents.
    When you are done, click on the Create button to start the document library creation process.

How it works…

After it finishes you should have a new library for you to use. You can repeat the process for all of the other business areas that you want to manage documents for – in our example we just used the standard business areas from the Dynamics AX navigation menu.

Creating Dynamics AX Document Types that Link to the Document Libraries

Once you have created your document libraries, you can connect them to Dynamics AX with the new SharePoint option so that the users are able to attach documents from the client and then store them within SharePoint for everyone to access.

How to do it…

To create a file attachment type that links to SharePoint, follow these steps:

  1. From the Organization administration area page, select the Document types menu item from the Document management folder of the Setup group.
  2. When the Document types maintenance form is displayed, click on the New button in the menu bar to create a new entry.
  3. We will start by creating a link for all of our generic Accounts Payable documents by giving our new Document type a Name and Description. In the Group select File from the dropdown options and select SharePoint for the Location option.
  4. Now return back to your document libraries within SharePoint and copy the URL for the document library.
  5. Paste the URL into the Archive
    directory field.

    Note: Remove all of the extra parameters though so that you are just referencing the base folder location.
    Also, if you click on the folder browser to the right of the Archive directory field you can test the link to SharePoint.

How it works…

Now, if you attach a document, then you will see the option for your new document type.

It will allow you to attach any file that you have on your desktop.

And rather than showing you the thumbnail image, it will show you a reference link to your SharePoint document library.

After attaching the document, if you look within SharePoint, you will see your document is saved away for you.

You can repeat this process for all of your other document libraries that were created in the previous step.

Adding Columns to your Document Libraries for Better Indexing

One of the reasons why you want to start using SharePoint is so that you can take advantage of the indexing functionality to code and classify your documents. Now that you have people storing the documents away, it’s time to add some indexes to you document libraries.

How to do it…

To create new indexes for your document libraries, follow these steps:

  1. Open up your document libraries within SharePoint and select the Library ribbon bar. Then click on the Create Column button within the Manage Views group.
  2. When the Create Column form opens, set the Column Name to be the field that you want to index, select the type of the column, and also set the columns Description.
  3. Note: Sometimes it’s a good idea not to have spaces in the column name, later on when we add filters, it becomes a litter easier to manage this way.
  4. After you have finished defining the column, click on the OK button to add the column to your library.
  5. When you return back to your document library, there will be a new column on the form.
  6. Repeat the process for all of the columns that you want to use as index fields for the library.

    Note: All of the columns do not have to be used during the indexing process, so it’s OK to have variations of columns, like InvoiceNum, CreditNoteNum, etc.

How it works…

To edit the columns, select the options menu for the document, and choose the Edit Properties option.

This will allow you to update the fields that Dynamics AX did not populate initially.

Now when you look at the document within SharePoint, you will see the additional metadata that is associated with the document.

Embedding Document Libraries into Dynamics AX Forms

Now that we are able to index documents a little more effectively within SharePoint, we can go the extra step, and link SharePoint to our forms within Dynamics AX so that we are able to access them without even leaving the application. Doing this just requires a little bit of coding, but is well worth the effort.

Getting Started…

You can manipulate the information that is displayed by SharePoint, and also how it is displayed through the URL that you use.

If you filter any of the views, then you will notice that it uses two qualifiers – FilterFieldX
and FilterValueX to restrict the viewed records.

Also, if you add a IsDlg=1 qualifier, then all of the navigation areas are hidden giving you a clean list of filtered documents.

This is the perfect type of view to embed within Dynamics AX.

The other half of this step is to choose a form to add your document libraries to. In this case we will update the Vendors form.

How to do it…

To embed your SharePoint document libraries within Dynamics AX forms, follow these steps:

  1. Start the process by opening up AOT, and create a new project for this tweak.
  2. From the Forms area in the AOT, drag over the form that you want to add the documents to – in this case it’s the VendTable form.
  3. Expand out the form within the project, and navigate to the group that you want to add your document library view into.
  4. Right-mouse-click on the parent tab, and select the TabPane option from the New Control sub-menu.
  5. Reorder your tabs (ALT+UpArrow/DownArrow) so that they are in the sequence that you want and then give your new Tab Control a Name and Caption in the Properties section.
  6. Right-mouse-click on the new tab that you added for the document library and select the ActiveX control from the New Control sub menu.
  7. When the list of ActiveX controls are displayed, select the Microsoft Web Browser control, and click the OK button to add it.
  8. Rename your ActiveX control, and set the Width to Column width
    and Height to Column height.
  9. Now we need to have Dynamics AX update the URL that is navigated to when the form is opened. To do this, right-mouse-click on the parent Methods group for the form, and select the activate method from the Override methods submenu.
  10. Update the activate method by building the URL that will define the specific document index that you are wanting to show. You are able to now add conditional filters that pick up the record values, and filter based on the current record – in this case the vendor number.
  11. Once you have finished the update, save the project.

How it works…

Now when you open up the Vendor form, there will be a Documents tab that shows all of the documents that are associated with the current record.

If you select a record that does not have attached documents, then you will not see anything there.

How cool is that.

Creating Custom Views for the Document Libraries

Now that all of the heavy lifting has been done, you can now start tweaking the SharePoint libraries and the way that the information is displayed. Based on the form that you are in you may want to show only particular information. You can do that by creating new custom views.

How to do it…

To create a custom view for your document libraries, follow these steps:

  1. Open up your document libraries within SharePoint and select the Library ribbon bar. Then click on the Library Settings button within the Settings group.
  2. When the document library settings maintenance form is displayed, scroll down to the bottom of the page, and there will be a section for Views that will show you all of the different ways that the form could be displayed. In this case there is only one, but we can fix that by clicking on the Create View link.
  3. Select the Standard View option from the format templates that are displayed.
  4. Assign your new view a Name and select the fields that you want to be displayed in the view.
  5. Once you have made the changes, click on the OK button to save your new view.

How it works…

When you return to the document library you will be able to see the new format of the view.

You can then change the view within the URL of your project to make it the default view for the form.

Now when you see all of the documents within your Dynamics AX form you will see just the information that you need.

Using the SharePoint Designer to Edit Document Libraries

Although you can do everything that we have shown so far within SharePoint, you can also take advantage of the SharePoint Designer application to update your SharePoint document libraries. You don’t even have to search for the install kit, because it is embedded within your SharePoint site, just waiting to be downloaded and installed.

How to do it…

To access the SharePoint Designer to manipulate your SharePoint site, follow these steps:

  1. To use the SharePoint Designer to update your SharePoint site, just select the Edit in SharePoint Designer option from the Site Actions menu.

    Note: If you don’t have SharePoint Designer installed then it will ask you to install it, and download the kit directly from your SharePoint installation.

How it works…

When SharePoint Designer opens up, it will be connected to your current SharePoint site, showing you all of the libraries, etc. that you have been creating.

If you select the Lists and Libraries option from the navigation pad, you will be able to see all of the document libraries that you created in the previous steps.

Drilling into the libraries you will be able to also see all of the views etc. that you configured within SharePoint.

Creating New Content Types to Manage Document Types

When we set up our document libraries we deliberately created them so that all of the documents for a particular area are within the same library. This allows us to save multiple types of documents away within the library like Invoices, Credit Notes, Vendor Certificates etc. The way that we can identify the type of document is through the creation of Content Types.

How to do it…

To create custom Content Types to help make classification easier, follow these steps:

  1. Open up SharePoint Designer (although you can also do this within SharePoint itself) and select the Content Types from the navigation menu and click on the Content type menu button within the New group
    of the Content Types ribbon bar.
  2. When the Content Type creation form is displayed, give your Content Type a Name, and Description, select a parent content type, and also a group that you want to show the Content Type in.

    Note: For the first content type that you create, you may want to create a new Content Type Group so that it isn’t intermingled with all of the other content types.

  3. When you have finished creating your Content Type click on the OK button to add it to SharePoint.
  4. When you return to your SharePoint Designer workspace you will be able to see your new Content Type.
  5. Repeat the process for all of the other types of documents that you want to file away within SharePoint.
  6. Now we need to enable Content Types within our document libraries, and then assign them. To do this, open up your Document Library within SharePoint Designer, and within the Settings group, check the Allow management of content types check box.
  7. Then click on the Add button to the right of the Content Types group to open up the Content Type Picker. Find the new Content Types that you just created, and click on the OK button to assign them to your Document Library.
  8. Now the Content Type will show up as a valid option for the document library.
  9. Repeat the process for all of the other content types that you created.

How it works…

Now when you edit the properties for your documents, there will be a new indexing option for your documents that allows you to define the type of document that you are looking at.

Specifying Document Columns by Content Types to Simplify Indexing

There is an additional benefit that you get from using Content Types within SharePoint, which is the ability to specify what columns are applicable to different Content Types at the time of indexing. For example, you probably don’t want to specify a Invoice Number when indexing a Vendor Insurance Certificate, but would definitely would want to when indexing an Invoice and even a Credit Note.

How to do it…

To modify your Content Types within your Document Libraries to only require certain columns to be indexed, follow these steps:

  1. From within your SharePoint Document Library (or from within SharePoint Designer) click on the Library Settings button within the Settings group of the Library ribbon bar.
  2. Within the Library Settings you will be able to see all of your Content Types that have been assigned. Select any of them to edit their options.
  3. When you first create the Content Types then they will have no columns assigned to them. Click on the Add from existing site or list columns link to assign the valid columns to your Content Type.
  4. When the Add columns to Content Type form is displayed, you will be able to see all of the available columns within the Document Library.
  5. Just select the ones that you want to use for the indexing, and then click the Add button. Once you have selected all the ones that you want to use, click on the OK button to save your changes.

How it works…

Now you will have indexing by Content Type.

Showing the Content Type in the Document View

Now that we are classifying documents by Content Type we might as well show it in the views so that we are able to differentiate different document types.

How to do it…

To add the Content Type field to our Document View, follow these steps:

  1. From within your SharePoint Document Library (or from within SharePoint Designer) click on the Modify View button within the Manage Views group of the Library ribbon bar.
  2. Now that the Content Type is enabled on our Document Library, it will show up on the list of valid columns. To add it to our view, just check the Display checkbox, and possibly change the order of the field so that it is first in the table.
  3. When you’re done, click on the OK button to update the view.

How it works…

Now the Content Type is shown in the document library view.

And also will show up when we browse to the documents within Dynamics AX.

How neat is that.

Grouping Records in the Document View by Key Columns

One final tweak that we will show within SharePoint is the ability to group columns within our document library views so that common information is shown together. These groupings can be different by view, and just make it a little easier to find information if we don’t’ initially filter the data.

How to do it…

To group records within your document library view, follow these steps:

  1. From within your SharePoint Document Library (or from within SharePoint Designer) click on the Modify View button within the Manage Views group of the Library ribbon bar.
  2. Scroll down your view definition until you see the Group By configuration options. Here you will be able to change the Group By fields.

How it works…

Now when you look at your documents, they will be classified by key fields.

Summary

In this walkthrough we have shown how you can:

  • Create a simple document management repository within SharePoint
  • Link the document attachments function within Dynamics AX to SharePoint to make the acquisition of the documents easier
  • Index your documents more effectively by defining custom columns
  • Embed SharePoint back into Dynamics AX and also
  • Tweak your views within SharePoint to make it easier to find and view documents

This is really just a starting point, and once you have mastered the basics, you can start investigating:

  • Assigning workflows to documents for approvals and updates
  • Enabling version control for your documents
  • Acquire documents into SharePoint through scanning technologies
  • Link the index column fields to Dynamics AX for validation of key information
  • And much more.

SharePoint is a great document management tool, and can usually handle all of your document indexing needs. Especially now that it is connected with Dynamics AX natively.

Tool to analyse and then upgrade your old SharePoint VBA Web Parts to Apps!!

office365[1]

Welcome to Microsoft VBA and SharePoint Code Analyzer

 Now is the time to still use that old VBA code you have!!

This is an online tool where you can upload your file and generate reports collecting detailed statistics about the user’s VBA and SharePoint source code files, providing useful information about migrating VBA and SharePoint applications.

To analyze your files please follow up this simple 4 steps:

How To : A library to create .mht files (available at request)

There are a number of ways to do this, including hosting Word or Excel on the Web Server and dealing with COM Interop issues, or purchasing third – party MIME encoding libraries, some of which sell for $250.00 or more. But, there is no native .NET solution. So, being the curious soul that I am, I decided to investigate a bit and see what I could come up with. Internet Explorer offers a File / Save As option to save a web page as “Web Archive, single file (*.mht)”.

Image

What this does is create an RFC – compliant Multipart MIME Message. Resources such as images are serialized to their Base64 inline encoding representations and each resource is demarcated with the standard multipart MIME header – breaks. Internet Explorer, Word, Excel and most newsreader programs all understand this format. The format, if saved with the file extension “.eml”, will come up as a web page inside Outlook Express; if saved with “.mht”, it will come up in Internet Explorer when the file is double-clicked out of Windows Explorer, and — what many do not know — if saved with a “*.doc” extension, it will load in MS Word, each with all the images intact, and in the case of the EML and MHT formats, with all of the hyperlinks fully-functioning. The primary advantage of the format is, of course, that all the resources can be consolidated into a single file,. making distribution and archiving much easier — including database storage in an NVarchar or NText type field.


System.Web.Mail, which .NET provides as a convenient wrapper around the CDO for Windows COM library, offers only a subset of the functionality exposed by the CDO library, and multipart MIME encoding is not a part of that functionality. However, through the wonders of COM Interop, we can create our own COM reference to CDO in the Visual Studio IDE, allowing it to generate a Runtime Callable Wrapper, and help ourselves to the entire rich set of functionality of CDO as we see fit.


One method in the CDO library that immediately came to my notice was the CreateMHTMLBody method. That’s MHTMLBody, meaning “Multipurpose Internet Mail Extension HTML (MHTML) Body”. Well!– when I saw that, my eyes lit up like the LED’s on a 32 – way Unisys box! This is a method on the CDO Message class; the method accepts a URI to the requested resource, along with some enumerations, and creates a MultiPart MIME – encoded email message out of the requested URI responses — including images, css and script — in one fell swoop.


“Ah”, you say, “How convenient”! Yes, and not only that, but we also get a free “multipart COM Interop Baggage” reference to the ADODB.Stream object – and by simply calling the GetStream method on the Message Class, and then using the Stream’s SaveToFile method, we can grab any resource including images, javascript, css and everything else (except video) and save it to a single MHT Web Archive file just as if we chose the “Save As” option out of Internet Explorer.


If we choose not to save the file, but instead want to get back the stream contents, no problem. We just call Stream.ReadText(Stream.Size) and it returns a string containing the entire MHT encoded content. At that point we can do whatever we want with it – set a content – header and Response .Write the content to the browser, for instance — or whatever.


For example, when we get back our “MHT” string, we can write the following code:

Response.ContentType=”application/msword”;
Response.AddHeader( “Content-Disposition”, “attachment;filename=NAME.doc”);
Response.Write(myDataString);


— and the browser will dutifully offer to save the file as a Word Document. It will still be Multipart MIME encoded, but the .doc extension on the filename allows Word to load it, and Word is smart enough to be able to parse and render the file very nicely. “Ah”, you are saying, “this is nice, and so is the price!”. Yup!

And, if you are serving this MIME-encoded file from out of your database, for example, and you would like it to be able to be displayed in the browser, just change the “NAME.doc” to “NAME.MHT”, and don’t set a content-type header. Internet Explorer will prompt the user to either save or open the file. If they choose “open”, it will be saved to the IE Temporary files and open up in the browser just as if they had loaded it from their local file system.


So, to answer a couple of questions that came up recently, yes — you can use this method to MHTML – encode any web page – even one that is dynamically generated as with a report — provided it has a URL, and save the MIME-encoded content as a string in either an NVarchar or NText column in your database. You can then bring this string back out and send it to the browser, images,css, javascript and all.

Now here is the code for a small, very basic “Converter” class I’ve written to take advantage of the two scenarios specified above. Bear in mind, there is much more available in CDO, but I leave this wondrous trail of ecstatic discovery to your whims of fancy:

using System;
using System.Web;
using CDO;
using ADODB;
using System.Text;
namespace PAB.Web.Utils
{
 public class MIMEConverter
 {
  //private ctor as our methods are all static here
  private MIMEConverter()
  {
   
  }   
  public static bool SaveWebPageToMHTFile( string url, string filePath)
  {
   bool result=false;
   CDO.Message  msg = new CDO.MessageClass(); 
   ADODB.Stream  stm=null ;
   try
   {
    msg.MimeFormatted =true;   
    msg.CreateMHTMLBody(url,CDO.CdoMHTMLFlags.cdoSuppressNone, "" ,"" );
stm = msg.GetStream(); stm.SaveToFile(filePath,ADODB.SaveOptionsEnum.adSaveCreateOverWrite); msg=null; stm.Close(); result=true; } catch {throw;} finally { //cleanup here } return result; } public static string ConvertWebPageToMHTString( string url ) { string data = String.Empty; CDO.Message msg = new CDO.MessageClass(); ADODB.Stream stm=null; try { msg.MimeFormatted =true; msg.CreateMHTMLBody(url,CDO.CdoMHTMLFlags.cdoSuppressNone,
"", "" );
stm = msg.GetStream(); data= stm.ReadText(stm.Size); } catch { throw; } finally { //cleanup here } return data; } } }


NOTE: When using this type of COM Interop from an ASP.NET web page, it is important to remember that you must set the AspCompat=”true” directive in the Page declaration or you will be very disappointed at the results! This forces the ASP.NET page to run in STA threading model which permits “classic ASP” style COM calls. There is, of course, a significant performance penalty incurred, but realistically, this type of operation would only be performed upon user request and not on every page request.

<

p align=”left”>The downloadable zip file below contains the entire class library and a web solution that will exercise both methods when you fill in a valid URI with protocol, and a valid file path and filename for saving on the server. Unzip this to a folder that you have named “ConvertToMHT” and then mark the folder as an IIS Application so that your request such as “http://localhost/ConvertToMHT/WebForm1.aspx&#8221; will function correctly. You can then load the Solution file and it should work “out of the box”. And, don’t forget – if you have an ASP.NET web application that wants to write a file to the file system on the server, it must be running under an identity that has been granted this permission.

How To : Make use of Application Insights (with a great VS extension available freely)

You can now add Application Insights telemetry right from Visual Studio to new or existing projects in 2 clicks or less.

This release of Application Insights Tools for Visual Studio is in PREVIEW; see Known Issues below.

Get Started

To get started with a new project, simply create a Web, Windows Store 8.1, or Windows Phone 8.0 project. In the New Project dialog, make sure that Add Application Insights to Project is checked.

To get started with an existing project, right-click on a Web, Windows Store 8.1, or Windows Phone 8.0 project in Solution Explorer and choose Add Application Insights Telemetry to Project.

That’s it! Then run your Web application locally (or deploy your application), and after 10-15 minutes, telemetry data will automatically start appearing in the Application Insights Portal in the Usage tab.

Additional project types are supported with partial automation (see Known Issues below)

Q & A

Q: I don’t see the Add Application Insights Telemetry to Project command.

A: The type of app you’re creating is not supported yet. Instead, add your application at the Application Insights portal.

Q: Oops. I closed the Application Insights browser. How do I get it back?

A: In Solution Explorer, in the context menu of the project, choose Open Application Insights Portal…

Q: What other telemetry can I log from my app?

A: You can log events and metrics. Take a look at Improve your application from live usage data

Known Issues

This release of Application Insights Tools for Visual Studio is in PREVIEW. There are a number of known issues, including:

  • If you are upgrading from version 0.6.56.3 of the Application Insights Telemetry SDK for Services using the Application Insights Tools for Visual Studio, you will need to manually copy any custom settings from Monitoring.CollectionPlan.config to ApplicationInsights.config file.
  • For Windows Store 8.1 C++ projects instrumented with Application Insights, updates for the “Application Insights Telemetry SDK for Windows Store Apps” from nuget.org do not show up in the “Manage NuGet Packages” dialog. You can install an updated nuget package from the “Online” section of the “Manage NuGet Packages” dialog. Or, you can execute this command in the Package Manager Console: update-package Microsoft.ApplicationInsights.Telemetry.WindowsStore

DRY Architecture, Layered Architecture, Domain Driven Design and a Framework to build great Single Web Pages – BiolerPlate Part 1

DRY – Don’t Repeat Yourself! is one of the main ideas of a good developer while developing a software. We’re trying to implement it from simple methods to classes and modules. What about developing a new web based application? We, software developers, have similar needs when developing enterprise web applications.

Enterprise web applications need login pages, user/role management infrastructure, user/application setting management, localization and so on. Also, a high quality and large scale software implements best practices such as Layered Architecture, Domain Driven Design (DDD), Dependency Injection (DI). Also, we use tools for Object-Releational Mapping (ORM), Database Migrations, Logging… etc. When it comes to the User Interface (UI), it’s not much different.

Starting a new enterprise web application is a hard work. Since all applications need some common tasks, we’re repeating ourselves. Many companies are developing their own Application Frameworks or Libraries for such common tasks to do not re-develop same things. Others are copying some parts of existing applications and preparing a start point for their new application. First approach is pretty good if your company is big enough and has time to develop such a framework.

As a software architect, I also developed such a framework im my company. But, there is some point it feels me bad: Many company repeats same tasks. What if we can share more, repeat less? What if DRY principle is implemented universally instead of per project or per company? It sounds utopian, but I think there may be a starting point for that!

What is ASP.NET Boilerplate?

http://www.aspnetboilerplate.com/

ASP.NET Boilerplate [1] is a starting point for new modern web applications using best practices and most popular tools. It’s aimed to be a solid model, a general-purpose application framework and a project template. What it does?

  • Server side
    • Based on latest ASP.NET MVC and Web API.
    • Implements Domain Driven Design (Entities, Repositories, Domain Services, Application Services, DTOs, Unif Of Work… and so on)
    • Implements Layered Architecture (Domain, Application, Presentation and Infrastructure Layers).
    • Provides an infrastructure to develop reusable and composable modules for large projects.
    • Uses most popular frameworks/libraries as (probably) you’re already using.
    • Provides an infrastructure and make it easy to use Dependency Injection (uses Castle Windsor as DI container).
    • Provides a strict model and base classes to use Object-Releational Mapping easily (uses NHibernate, can work with many DBMS).
    • Implements database migrations (uses FluentMigrator).
    • Includes a simple and flexible localization system.
    • Includes an EventBus for server-side global domain events.
    • Manages exception handling and validation.
    • Creates dynamic Web API layer for application services.
    • Provides base and helper classes to implement some common tasks.
    • Uses convention over configuration principle.
  • Client side
    • Provides two project templates. One for Single-Page Applications using Durandaljs, other one is a Multi-Page Application. Both templates uses Twitter Bootstrap.
    • Most used libraries are included by default: Knockout.js, Require.js, jQuery and some useful plug-ins.
    • Creates dynamic javascript proxies to call application services (using dynamic Web API layer) easily.
    • Includes unique APIs for some sommon tasks: showing alerts & notifications, blocking UI, making AJAX requests.

Beside these common infrastructure, the “Core Module” is being developed. It will provide a role and permission based authorization system (implementing ASP.NET Identity Framework), a setting systems and so on.

What ASP.NET Boilerplate is not?

ASP.NET Boilerplate provides an application development model with best practices. It has base classes, interfaces and tools that makes easy to build maintainable large-scale applications. But..

  • It’s not one of RAD (Rapid Application Development) tools those provide infrastructure for building applications without coding. Instead, it provides an infrastructure to code in best practices.
  • It’s not a code generation tool. While it has several features those build dynamic code in run-time, it does not generate codes.
  • It’s not a all-in-one framework. Instead, it uses well known tools/libraries for specific tasks (like NHibernate for O/RM, Log4Net for logging, Castle Windsor as DI container).

Getting started

In this article, I’ll show how to deleveop a Single-Page and Responsive Web Application using ASP.NET Boilerplate (I’ll call it as ABP from now). This sample application is named as “Simple Task System” and it consists of two pages: one for list of tasks, other one is to add new tasks. A Task can be related to a person, can be completed. The application is localized in two languages. Screenshot of Task List in the application is shown below:

A screenshot of 'Simple Task System'

Creating empty web application from template

ABP provides two templates to start a new project (Even if you can manually create your project and get ABP packages from nuget, template way is much more easy). Go to www.aspnetboilerplate.com/Templates to create your application from one of twotemplates (one for SPA (Single-Page Application), one for MPA (classic, Multi-Page Application) projects):

Creating template from ABP web site

I named my project as SimpleTaskSystem and created a SPA project. It downloaded project as a zip file. When I open the zip file, I see a solution is ready that contains assemblies (projects) for each layer of Domain Driven Design:

Project files

Created project’s runtime is .NET Framework 4.5.1, I advice to open with Visual Studio 2013. The only prerequise to be able to run the project is to create a database. SPA template assumes that you’re using SQL Server 2008 or later. But you can change it easily to another DBMS.

See the connection string in web.config file of the web project:

<add name="MainDb" connectionString="Server=localhost; Database=SimpleTaskSystemDb; Trusted_Connection=True;" />

You can change connection string here. I don’t change the database name, so I’m creating an empty database, named SimpleTaskSystemDb, in SQL Server:

Empty database

That’s it, your project is ready to run! Open it in VS2013 and press F5:

First run

Template consists of two pages: One for Home page, other is About page. It’s localized in English and Turkish. And it’s Single-Page Application! Try to navigate between pages, you’ll see that only the contents are changing, navigation menu is fixed, all scripts and styles are loaded only once. And it’s responsive. Try to change size of the browser.

Now, I’ll show how to change the application to a Simple Task System application layer by layer in the coming part 2

Great Agile Develipment Tool – Agile Planner

Great Agile Development project – /http://agileplanner.codeplex.com/

Project Description

This project is to develop an interation planning tool for agile project management.

What’s new?

Release: 1.0.0, run in Visual Studio integrated mode. See how to use for details.

What is Agile Planner?

This tool is for agile project teams, who currently are using sticky notes on the wall. With this tool stories, backlog and iterations are managed in a graphic designer, saved as files within visual studio projects and can be exported to images, reports and etc.

Main features are

  • Stories can be drag and dropped between backlog and iterations
  • Iteration’s capacity calculated automatically base on stories within it
  • Stories are rendered base on customizable status or priority color schema
  • Diagram can be exported to PNG image for printing, documentation and sharing

Here are examples.

Stories rendered based on status
agile-stories-on-status-s.png

Stories rendered base on priority
agile-stories-on-priority-s.png


How to use Agile Planner

1. Install
To install Agile Planner,

  • Download the runtime binary zip file from the latest releases
  • Extract all files from the runtime binary zip file
  • Run the windows installer AgilePlanner.msi (requires elevated command prompt under Vista and administrator on XP/2003).

2. Get Started
To start use Agile Planner in Visual Studio 2008 project

  • Start Visual Studio 2008, create new project or load existing project
  • Right click the project name and select menu “Add | New Item …”

add-new-item.PNG

  • Select AgilePlanner
  • Dismiss the security warning if it shows up

You will be presented a designing environment like below.

designer.PNG

  1. Graphical designer for iterations and stories
  2. Toolbox for iterations and stories
  3. Treeview Explorer for iterations and stories
  4. Property window for iterations and stories

3. Plan your project’s iterations

  • Create iterations by dragging iteration tool from toolbox to the graphical designer
  • Create Stories by dragging story tool from toolbox to the backlog and iterations
  • Edit stories’ properties such as name, capacity, priority and status the property window

add-stories.PNG

Notice: the capacity of iteration updated automatically after dragged stories between iterations and after updated the stories’ capacity property, so that you can balance the work load between iterations.

4. Render the diagram
The stories can be colored based on either their status or priority. To switch between these two options, right click the diagram and select menu “Color on Status” or “Color on Priority”. The color schema are customizable as the property of the project.

render-in-priority.PNG

5. Export
The rendered diagram can be exported to png file by right clicking on the diagram and select menu “Export to image”.

exported.png

How to use it?

See how to use

How To : Use SharePoint Dashboards & MSRS Reports for your Agile Development Life Cycle

The Problem We Solve

Agile BI is not a term many would associate with MSRS Reports and SharePoint Dashboards. While many organizations first turn to the Microsoft BI stack because of its familiarity, stitching together Microsoft’s patchwork of SharePoint, SQL Server, SSAS, MSRS, and Office creates administrative headaches and requires considerable time spent integrating and writing custom code.

This Showcase outlines the ease of accomplishing three of the most fundamental BI tasks with LogiXML technology as compared to MSRS and SharePoint:

  • Building a dashboard with multiple data sources
  • Creating interactive reports that reduce the load on IT by providing users self-service
  • Integrating disparate data sources

Read below to learn how an agile BI methodology can make your life much easier when it comes to dashboards and reports. Don’t feel like reading?

Building a Dashboard with LogiXML vs. MSRS + SharePoint

Microsoft’s only solution for dashboards is to either write your own code from scratch, manipulate SharePoint to serve a purpose for which it wasn’t initially designed, or look to third party apps. Below are some of the limitations to Microsoft’s approach to dashboards:

  • Limited Pre-Built Elements: Microsoft components come with only limited libraries of pre-built elements. In addition to actual development work, you will need to come up with an idea of how everything will work together. This necessitates becoming familiar with best practices in dashboards and reporting.
  • Sophisticated Development Expertise Required: While Microsoft components provide basic capabilities, anything more sophisticated is development resource-intensive and requires you to take on design, execution, and delivery. Any complex report visualizations and logic, such as interactive filters, must be written in code by the developer.
  • Limited Charts and Visualizations: Microsoft has a smaller sub-set of charts and visualization tools. If you want access to the complete library of .NET-capable charts, you’ll still need to OEM another charting solution at additional expense.
  • Lack of Integrated Workflow: Microsoft does not include workflow features sets out of the box in their BI offering.

LogiXML technology is centered on Logi Studio: an elemental, agile BI design environment which lets you simply choose from hundreds of powerful and configurable pre-built elements. Logi’s pre-built elements equip developers with tools to speed development, as well as the processes and logic required to build and manage BI projects. Below is a screen shot of the Logi Studio while building new dashboards.

agile-bi.jpg

Start a free LogiXML trial now.

Logi developers can easily create static or user-customizable dashboards using the Dashboard element. A dashboard is a collection of panels containing Logi reports, which in turn contain table, charts, images, etc. At runtime, the user can customize the dashboard by rearranging these panels on the browser page, by showing or hiding them, and even by changing their contents using adjustable reporting criteria. The data displayed within the panels can be configured, as in any Logi report, to link to other reports, providing drill-down functionality.


logi2.jpg

The dashboard displayed above has tabs and user customization enabled. The Dashboard element provides customization features, such as drag-and-drop panel positioning, support for built-in parameters the user can access to adjust the panel’s data contents, and a panel selection list that determines which panels will be displayed. AJAX techniques are utilized for web server interactions, allowing selective updates of portions of the dashboard. Dashboard customizations can be saved on an individual-user basis to create a highly personalized view of the data.

The Dashboard Wizard

The ‘Create a Dashboard’ wizard assists developers in creating dashboards by populating the report definition with the necessary dashboard-related elements. You can easily point to any data source by selecting from a variety of DataLayer types, including SQL, StoredProcedures, Web Services, Files, and more. A simple to use drag and drop SQL Query builder is also integrated, to offer a guided approach to constructing queries when connecting to your database.

logi3.jpg

Using the Dashboard Element

The Dashboard element is used to create the top level structure for all of your interactive panels within the final output. Under your dashboards, you can optionally add any number of Dashboard Panels, Panel Parameters for dynamic filtering, and even automatic refresh features with AJAX-based refresh timers.

logi4.jpg

Changing Appearance Using Themes and Style Sheets

The appearance of a dashboard can be changed easily by assigning a theme to your report. In addition, or as an alternative, you can change dashboard appearance using style. The Dashboard element has its own Cascading Style Sheet (CSS) file containing predefined classes that affect the display colors, font sizes, button labels, and spacing seen when the dashboard is displayed. You can override these classes by adding classes with the same name to your own style sheet file.

See us build a BI app with 3 data sources in under 10 minutes.

Ad Hoc Reporting Creation with LogiXML: Analysis Grid

The Analysis Grid is a managed reporting feature giving end users virtual ad hoc capability. It is an easy to use tool that allows business users to analyze and manipulate data and outputs in multiple and powerful ways.

logi5.jpg

Start a free LogiXML trial now.

Create an Analysis Grid by using the “Create Analysis Grid” wizard, or by simply adding the AnalysisGrid element into your definition file. Like the dashboard, data for the Analysis Grid can be accessed from any of the data options, including SQL databases, web sources, or files. You also have the option to launch the interactive query builder wizard for easy, drag-drop, SQL query creation.

The Analysis Grid is composed of three main parts: the data grid itself, i.e. a table of data to be analyzed; various action buttons at the top, allowing the user to perform actions such as create new columns with custom calculations, sort columns, add charts, and perform aggregations; and the ability to export the grid to Excel, CSV, or PDF format.

The Analysis Grid makes it easy to perform what-if analyses through features like filtering. The Grid also makes data-presentation impactful through visualization features including data driven color formatting, inline gauges, and custom formula creation.

Ad Hoc Reporting Creation with Microsoft

While simple ad hoc capabilities, such as enabling the selection of parameters like date ranges, can be accomplished quickly and easily with Microsoft, more sophisticated ad hoc analysis is challenging due to the following shortcomings.

Platform Integration Problems

Microsoft BI strategy is not unified and is strongly tied to SQL Server. To obtain analysis capabilities, you must build cubes through to the Analysis Service, which is a separate product with its own different security architecture. Next, you will need to build reports that talk to SQL server, also using separate products.

Dashboards require a SharePoint portal which is, again, a separate product with separate requirements and licensing. If you don’t use this, you must completely code your dashboards from scratch. Unfortunately, Microsoft Reporting Services doesn’t play well with Analysis Services or SharePoint since these were built on different technologies.

SharePoint itself offers an out of the box portal and dashboard solution but unfortunately with a number of significant shortcomings. SharePoint was designed as a document management and collaboration tool as opposed to an interactive BI dashboard solution. Therefore, in order to have a dashboard solution optimized for BI, reporting, and interactivity you are faced with two options:

  • Build it yourself using .NET and a combination of third party components
  • Buy a separate third party product

Many IT professionals find these to be rather unappealing options, since they require evaluating a new product or components, and/or a lot of work to build and make sure it integrates with the rest of the Microsoft stack.

Additionally, while SQL Server and other products support different types of security architectures, Analysis Services only has support for using integrated Windows NT security models to access cubes and therefore creates integration challenges.

Moreover, for client/ad hoc tools, you need Report Writer, a desktop product, or Excel – another desktop application. In addition to requiring separate licenses, these products don’t even talk to one another in the same ways, as they were built by different companies and subsequently acquired by Microsoft.

Each product requires a separate and often disconnected development environment with different design and administration features. Therefore to manage Microsoft BI, you must have all of these development environments available and know how to use them all.

Integration of Various Data Sources: LogiXML vs. Microsoft

LogiXML is data neutral, allowing you to easily connect to all of your organization’s data spread across multiple applications and databases. You can connect with any data source or data model and even combine data sources such as current data accessed through a web service with past data in spreadsheets.

Integration of Various Data Sources with Microsoft

Working with Microsoft components for BI means you will be faced with the challenge of limited support for non-Microsoft based databases and outside data sources. The Microsoft BI stack is centered on SQL Server databases and therefore the data source is optimized to work with SQL Server. Unfortunately, if you need outside content it can be very difficult to integrate.

Finally, Microsoft BI tools are designed with the total Microsoft experience in mind and are therefore optimized for Internet Explorer. While other browsers and devices might be useable, the experience isn’t optimized and may potentially lack in features or visualize differently.


Free & Licensed Windows 8, Azure, Office 365, SharePoint On-Premise and Online Tools, Web Parts, Apps available.
For more detail visit https://sharepointsamurai.wordpress.com or contact me at tomas.floyd@outlook.com

Introduction to the Unified Logging Service and Creating a Javascript Logging System

Microsoft SharePoint Foundation exposes a rich logging mechanism known as the Unified Logging Service (ULS) that enables developers to write useful information helping them to identify and troubleshoot issues during the application lifecycle. The ULS writes SharePoint Foundation events to the SharePoint Trace Log, and stores them in the file system, typically inside the SharePoint root folder in files named \14\LOGS\SERVERYYYmmDDID.log.

ULS exposes a rich managed object model enabling developers to specify their own configurations such as categories and severity while writing exceptions or trace message to the ULS logs. You can find more details on the managed API in the article Writing to the Trace Log from Custom Code.

With the evolution of a rich client object model in SharePoint 2010 that enables developers to build complex client applications, it is very important to write useful information that is not visible in the user interface but is recorded on the server so it can be monitored by administrators and developers.

To address these scenarios for applications running in thin-client browsers, SharePoint Foundation provides a web service named SharePoint Diagnostics (diagnostics.asmx). This web service enables a client application to submit diagnostic reports directly to the ULS logs.

This article focuses on how you can leverage the SharePoint Diagnostics web service to write trace messages from a custom JavaScript application into the ULS logs.

The following points are discussed:

  • Overview of the SendClientScriptErrorReport web method
  • Creating a simple JavaScript application to log trace messages by using SharePoint Diagnostics web service
  • Setting up the required configurations for enabling logging via the Diagnostics web service
  • Using the application
  • Using the ULS logging script with sandboxed solutions
The Diagnostics web service exposes a single method named SendClientScriptErrorReport that enables client applications to report errors to the ULS service. The following table summarizes the parameter list required by the SendClientScriptErrorReport method.

Parameter Name Description Value Examples
Message A string containing the message to display to the client The value of the displaypage property is null or undefined; not a function object.
File The URL file name associated with the current error customscript.js
Line A string containing the line of code from which the error is being generated 9
Client A string containing the client name that is experiencing the error <client><browser name=’Internet Explorer’ version=’9.0′></browser><language> en-us </language></client>
Stack A string containing the call-stack information from the generated error <stack><function depth=’0′ signature=’ myFunction() ‘>function myFunction() { ‘displaypage ();}</function></stack>
Team A string containing a team or product name Custom SharePoint Application
originalFile The physical file name associated with the current error customscript.js

In the table, notice that the example values for Client and Stack depict a XML fragments, not single lines of text. This information is stated in the protocol specification documented in 3.1.4.1.2.1 SendClientScriptErrorReport. Even though the protocol specification for these parameters requires a valid XML fragment, the web-service call to this method still succeeds even if the values supplied for these parameters do not follow this schema, despite the fact that creating the client and stack in this way would add more information to the trace.

The parameter list in the table shows that, unlike the managed API, the SendClientScriptErrorReport web method does not provide any option to specify the category or severity of the message being logged. Also looking at the method name and description, it appears that the exception logged should specify the severity level as Error. However, any message logged through the SharePoint Diagnostics web service is always displayed under the category Unified Logging Service and has a trace log severity level set to Verbose.

Later in this article, you will see the steps required to view the traces written through the SharePoint Diagnostics web service.

In this section, you create a JavaScript application that uses the Diagnostics web service to report errors to the ULS. The application contains a JavaScript file named ULSLogScript.js that contains the necessary functions to communicate and log traces to the Diagnostics web service. These functions are then called directly from any consumer script.

Note
This is a relatively simple application with just one file, so you are not creating a formal SharePoint solution; instead, you save the files directly to the Layouts directory in the SharePoint hive structure.

To create a JavaScript library containing the ULS logging logic

  1. Start Microsoft Visual Studio 2010.
  2. From the File menu, create a new JScript file and save it in the following path: <SharePoint Installation Folder>\14\TEMPLATE\LAYOUTS\LoggingSample\ULSLogScript.js.

    For example, C:\Program Files\Common Files\Microsoft Shared\Web Server Extensions\14\TEMPLATE\LAYOUTS\LoggingSample\ULSLogScript.js.

    Note
    You need to create a new directory named LoggingSample in the Layouts folder.
  3. Because you are using the JQuery library in the application, download the jquery-1.6.4.min.js file from the JQuery portal and add it to the LoggingSample folder created previously.
  4. Type or paste the following code into the ULSLogScript.js file.
    // Creates a custom ulslog object 
    // with the required properties.
    function ulsObject() {
        this.message = null;
        this.file = null;
        this.line = null;
        this.client = null;
        this.stack = null;
        this.team = null;
        this.originalFile = null;
    }
    

    The ulsObject function returns a new instance of a custom object with properties mapped to the parameters required by the SendClientScriptErrorReport method. This object is used throughout the script for performing various operations.

  5. Define the methods that populate the property values specified in the ulsObject method. Begin by defining the function that retrieves the client property. Following the ulsObject method, type or paste the following code.
    // Detecting the browser to create the client information
    // in the required format.
    function getClientInfo() {
        var browserName = '';
    
        if (jQuery.browser.msie)
            browserName = "Internet Explorer";
        else if (jQuery.browser.mozilla)
            browserName = "Firefox";
        else if (jQuery.browser.safari)
            browserName = "Safari";
        else if (jQuery.browser.opera)
            browserName = "Opera";
        else
            browserName = "Unknown";
    
        var browserVersion = jQuery.browser.version;
        var browserLanguage = navigator.language;
        if (browserLanguage == undefined) {
            browserLanguage = navigator.userLanguage;
        }
    
        var client = "<client><browser name='{0}' version='{1}'></browser><language>{2}</language></client>";
        client = String.format(client, browserName, browserVersion, browserLanguage);
     
        return client;
    }
    
    // Utility function to assist string formatting.
    String.format = function () {
        var s = arguments[0];
        for (var i = 0; i < arguments.length - 1; i++) {
            var reg = new RegExp("\\{" + i + "\\}", "gm");
            s = s.replace(reg, arguments[i + 1]);
        }
    
        return s;
    }
    

    The getClientInfo function uses the JQuery library to detect the current browser properties, such as the name and version, and then creates a XML fragment (as discussed previously) describing the browser details where the application is currently running. Additionally, a utility function named String.format assists string formatting through the code.

  6. Next, you need a function to create the call stack for the exception raised in the script. Add the following functions to the ULSLogScript.js code.
    // Creates the callstack in the required format 
    // using the caller function definition.
    function getCallStack(functionDef, depth) {
        if (functionDef != null) {
            var signature = '';
            functionDef = functionDef.toString();
            signature = functionDef.substring(0, functionDef.indexOf("{"));
            if (signature.indexOf("function") == 0) {
                signature = signature.substring(8);
            }
    
            if (depth == 0) {
                var stack = "<stack><function depth='0' signature='{0}'>{1}</function></stack>";
                stack = String.format(stack, signature, functionDef);
            }
            else {
                var stack = "<stack><function depth='1' signature='{0}'></function></stack>";
                stack = String.format(stack, signature);
            }
    
            return stack;
        }
    
        return "";
    }
    

    The getCallStack function receives the function definition where the exception occurred and a depth as a parameter. The depth parameter is used by the function to decide if only the caller function signature is required or the complete function definition is to be included. Based on the caller function definition, the getCallStack function extracts the required information such as the signature, body, and creates an XML fragment as described in the protocol specification.

  7. Next, create a function that creates a SOAP packet in the format expected by the Diagnostics web service SendClientScriptErrorReport method. Type or paste the following functions in the ULSLogScript.js file.
    // Creates the SOAP packet required by SendClientScriptErrorReport
    // web method.
    function generateErrorPacket(ulsObj) {
        var soapPacket = "<?xml version=\"1.0\" encoding=\"utf-8\"?>" +
                            "<soap:Envelope xmlns:xsi=\"http://www.w3.org/2001/XMLSchema-instance\" " +
                                           "xmlns:xsd=\"http://www.w3.org/2001/XMLSchema\" "+
                                           "xmlns:soap=\"http://schemas.xmlsoap.org/soap/envelope/\">" +
                              "<soap:Body>" +
                                "<SendClientScriptErrorReport " +
                                  "xmlns=\"http://schemas.microsoft.com/sharepoint/diagnostics/\">" +
                                  "<message>{0}</message>" +
                                  "<file>{1}</file>" +
                                  "<line>{2}</line>" +
                                  "<stack>{3}</stack>" +
                                  "<client>{4}</client>" +
                                  "<team>{5}</team>" +
                                  "<originalFile>{6}</originalFile>" +
                                "</SendClientScriptErrorReport>" +
                              "</soap:Body>" +
                            "</soap:Envelope>";
     
        soapPacket = String.format(soapPacket, encodeXmlString(ulsObj.message), encodeXmlString(ulsObj.file), 
                     ulsObj.line, encodeXmlString(ulsObj.stack), encodeXmlString(ulsObj.client), 
                     encodeXmlString(ulsObj.team), encodeXmlString(ulsObj.originalFile));
     
        return soapPacket;
    }
    
    // Utility function to encode special characters in XML.
    function encodeXmlString(txt) {
        txt = String(txt);
        txt = jQuery.trim(txt);
        txt = txt.replace(/&/g, "&amp;");
        txt = txt.replace(/</g, "&lt;");
        txt = txt.replace(/>/g, "&gt;");
        txt = txt.replace(/'/g, "&apos;");
        txt = txt.replace(/"/g, "&quot;");
     
        return txt;
    }
    

    The generateErrorPacket function receives an instance of the ulsObj object and returns the SOAP packet for the SendClientScriptErrorReport function as a string in the expected format. Because the values for the some parameters are expected as an XML fragment, the encodeXmlString function is used to encode the special characters.

  8. When the SOAP packet has been defined, you need a function to issue an asynchronous request to the Diagnostics web service. Add the code below to the ULSLogScript.js file.
    // Function to form the Diagnostics service URL.
    function getWebSvcUrl() {
        var serverurl = location.href;
        if (serverurl.indexOf("?") != -1) {
            serverurl = serverurl.replace(location.search, '');
        }
     
        var index = serverurl.lastIndexOf("/");
        serverurl = serverurl.substring(0, index - 1);
        serverurl = serverurl.concat('/_vti_bin/diagnostics.asmx');
     
        return serverurl;
    }
    
    // Method to post the SOAP packet to the Diagnostic web service.
    function postMessageToULSSvc(soapPacket) {
        $(document).ready(function () {
            $.ajax({
                url: getWebSvcUrl(),
                type: "POST",
                dataType: "xml",
                data: soapPacket, //soap packet.
                contentType: "text/xml; charset=\"utf-8\"",
                success: handleResponse, // Invoke when the web service call is successful.
                error: handleError// Invoke when the web service call fails.
            });
        });
    }
    
    // Invoked when the web service call succeeds.
    function handleResponse(data, textStatus, jqXHR) {
        // Custom code...
        alert('Successfully logged trace to ULS');
     }
     
    // Invoked when the web service call fails.
    function handleError(jqXHR, textStatus, errorThrown) {
        //Custom code...
            alert('Error occurred in executing the web request');
    }
    

    The postMessageToULSSvc function perform an asynchronous HTTP request and posts the SOAP packet to the Diagnostics web service. The URL of the Diagnostics web service is dynamically constructed in the getWebSvcUrl function. The postMessageToULSSvc function also defines respective handlers for success or error responses. Instead of displaying alerts on the handlers, other logic can be written as required by the application.

  9. Finally, you need a function that is invoked automatically when an error occurs in the code. To register this function globally for all the JavaScript functions on the page, you attach this function to the window.onerror event. Add the following lines of code as the first line of the ULSLogScript.js file.
    // Registering the ULS logging function on a global level.
    window.onerror = logErrorToULS;
    
    // Set default value for teamName.
    var teamName = "Custom SharePoint Application";
    
    // Further add the logErrorToULS method at the end of the script.
    
    // Function to log messages to Diagnostic web service.
    // Invoked by the window.onerror message.
    function logErrorToULS(msg, url, linenumber) {
        var ulsObj = new ulsObject();
        ulsObj.message = "Error occurred: " + msg;
        ulsObj.file = url.substring(url.lastIndexOf("/") + 1); // Get the current file name.
        ulsObj.line = linenumber;
        ulsObj.stack = getCallStack(logErrorToULS.caller); // Create error call stack.
        ulsObj.client = getClientInfo(); // Create client information.
        ulsObj.team = teamName; // Declared in the consumer script.
        ulsObj.originalFile = ulsObj.file;
    
        var soapPacket = generateErrorPacket(ulsObj); // Create the soap packet.
        postMessageToULSSvc(soapPacket); // Post to the web service.
    
        return true;
    }
    

    The line window.onerror = logErrorToULS links the function logErrorToULS with the window.onerror event. This enables you to capture the required information such as the error message, line number, and error file. The teamName variable enables you to set a unique value with respect to the calling application. This can be overridden in the consumer scripts. The logErrorToULS function creates an instance of the ulsObj object and populates all of its properties. Here, you see that the stack property of the ulsObj object is set to logErrorToULS.caller. This provides the function definition of the method that invoked this function. The postMessageToULSSvc function is called to write the error information to the trace logs.

    Note
    Because you cannot specify the security level of the trace message in the SendClientScriptErrorReport method, the message property of the ulsObj object is prepended with text indicating that the message logged is part of an exception.
  10. The logErrorToULS function is called automatically when an error occurs on the page, but to intentionally write a trace message to the ULS, you need one more function which can be called specifically. Add the following function just below the logErrorToULS function.
    // Function to log message to Diagnostic web service.
    // Specifically invoked by a consumer method.
    function logMessageToULS(message, fileName) {
        if (message != null) {
            var ulsObj = new ulsObject();
            ulsObj.message = message;
            ulsObj.file = fileName;
            ulsObj.line = 0; // We don't know the line, so we set it to zero.
            ulsObj.stack = getCallStack(logMessageToULS.caller);
            ulsObj.client = getClientInfo();
            ulsObj.team = teamName;
            ulsObj.originalFile = ulsObj.file;
    
            var soapPacket = generateErrorPacket(ulsObj);
            postMessageToULSSvc(soapPacket);
        }
    }
    

    Unlike the logErrorToULS function, the logMessageToULS function accepts the message to be logged and the file name where the error occurred as parameters.

So far, you have created the required logic to write trace messages or exceptions to the ULS logs. Now you need to write a function that consumes the logErrorToULS or logMessageToULS functions.

To create the consumer application

  1. Navigate to your SharePoint site.
  2. Create a new Web Parts page.
  3. Add a Content Editor Web Part in any of the available Web Part zones.
  4. Edit the Web Part and type or paste the following text in the HTML source.
    <script src="/_layouts/LoggingSample/jquery-1.6.4.min.js" type="text/javascript"></script>
     <script src="/_layouts/LoggingSample/ULSLogScript.js" type="text/javascript"></script>
     <script type="text/javascript">
            var teamName = "Simple ULS Logging";
            function doWork() {
                unknownFunction();
            }
            function logMessage() {
                logMessageToULS('This is a trace message from CEWP', 'loggingsample.aspx');
            }
     </script>
    
    <input type="button" value="Log Exception" onclick="doWork();" />
        <br /><br />
      <input type="button" value="Log Trace" onclick="logMessage();" />


    This HTML code contains the required script references to include the JQuery library and the ULSLogScript.js file that you created in the previous section. It also contains two inline JavaScript functions and the respective input buttons to invoke them.

    To demonstrate exception handling, the doWork function makes a call to an unknownFunction function that does not exist. This invokes an exception that is intercepted and logged by the ULSLogScript.js code. To demonstrate message logging, the logMessage function calls the logMessageToULS function to write trace messages to ULS.

  5. Exit the web page design mode.
  6. Save the Web Parts page.
Finally, you need to configure the Diagnostic Logging Service in SharePoint Central Administration to ensure that the traces and exceptions logged from the Diagnostics web service are visible in the ULS logs.

To configure the Diagnostic Logging Service

  1. Open SharePoint Central Administration.
  2. From the Quick Launch, click Monitoring.
    Figure 1. Click the Monitoring option

    Click the Monitoring option

  3. On the monitoring page, in the Reporting section, click Configure diagnostic logging.
    Figure 2. Click Configure diagnostic logging

    Click Configure diagnostic logging

  4. From all categories, expand the SharePoint Foundation category.
    Figure 3. Expand the SharePoint Foundation category

    Expand the SharePoint Foundation category

  5. Select the Unified Logging Service category.
    Figure 4. Select Unified Logging Service

    Select Unified Logging Service

  6. In the Least critical event to report to the trace log list, select Verbose.
    Figure 5. In the dropdown list, select Verbose

    From the dropdown list, select Verbose

  7. Click OK to save the configuration.

The server is now ready to log traces sent by the Diagnostics web service to ULS. These traces appear under the category Unified Logging Service with a severity set to Verbose.

In this section, you test the application by raising an alert that is logged to the ULS.

To test the logging application

  1. Click the Log Exception button inside the Content Editor Web Part (CEWP).
    Figure 6. Click the Log Exception button

    Click the Log Exception button

  2. An alert indicates that the message has been logged successfully to ULS.
    Figure 7. Confirmation message

    Confirmation message

  3. To see the exception details in the ULS logs, navigate to the Logs folder in the SharePoint hive ({SP Installation Path}\14\LOGS\)
  4. Because multiple log files can be present in the Logs folder, perform a descending sort on the Date modified field.
  5. Open the recent log file in a text editor such as Notepad and then search for Simple ULS Logging (the team name specified previously). Now you should see all the web service parameters as supplied from the client application, from Message to OriginalFileName, in the following text:

    10/14/2011 21:00:37.87 w3wp.exe (0x097C) 0x14DCSharePoint Foundation Unified Logging Service a084Verbose Message: Error occured: The value of the property ‘unknownFunction’ is null or undefined, not a Function object543a6672-9078-452f-93bd-545c4babefd510/14/2011 21:00:37.87 w3wp.exe (0x097C) 0x14DCSharePoint Foundation Unified Logging Service a085Verbose File: ULS%20Logging%20Sample.aspx543a6672-9078-452f-93bd-545c4babefd510/14/2011 21:00:37.87 w3wp.exe (0x097C) 0x14DCSharePoint Foundation Unified Logging Service a086Verbose Line: 676543a6672-9078-452f-93bd-545c4babefd510/14/2011 21:00:37.87 w3wp.exe (0x097C) 0x14DCSharePoint Foundation Unified Logging Service a087Verbose Client: <client><browser name=’Internet Explorer’ version=’8.0′></browser><language>en-us</language></client>543a6672-9078-452f-93bd-545c4babefd510/14/2011 21:00:37.87 w3wp.exe (0x097C) 0x14DCSharePoint Foundation Unified Logging Service a088Verbose Stack: <stack><function depth=’0′ signature=’ doWork() ‘>function doWork() { unknownFunction(); }</function></stack>543a6672-9078-452f-93bd-545c4babefd510/14/2011 21:00:37.87 w3wp.exe (0x097C) 0x14DCSharePoint Foundation Unified Logging Service a089Verbose TeamName: Simple ULS Logging543a6672-9078-452f-93bd-545c4babefd510/14/2011 21:00:37.87 w3wp.exe (0x097C) 0x14DCSharePoint Foundation Unified Logging Service a08aVerbose OriginalFileName: ULS%20Logging%20Sample.aspx543a6672-9078-452f-93bd-545c4babefd5

    Looking at the log message, you can easily determine that the exception occurred because unknownFunction was not defined, along with other relevant details such as the line number.

  6. Similarly, clicking Log Trace on the CEWP writes the following trace message:

    10/14/2011 21:29:55.76 w3wp.exe (0x097C) 0x0F6CSharePoint Foundation Unified Logging Service a084Verbose Message: This is a trace message from CEWP8c182889-c323-46f3-a287-a538c379f15210/14/2011 21:29:55.76 w3wp.exe (0x097C) 0x0F6CSharePoint Foundation Unified Logging Service a085Verbose File: loggingsample.aspx8c182889-c323-46f3-a287-a538c379f15210/14/2011 21:29:55.76 w3wp.exe (0x097C) 0x0F6CSharePoint Foundation Unified Logging Service a086Verbose Line: 08c182889-c323-46f3-a287-a538c379f15210/14/2011 21:29:55.76 w3wp.exe (0x097C) 0x0F6CSharePoint Foundation Unified Logging Service a087Verbose Client: <client><browser name=’Internet Explorer’ version=’8.0′></browser><language>en-us</language></client>8c182889-c323-46f3-a287-a538c379f15210/14/2011 21:29:55.76 w3wp.exe (0x097C) 0x0F6CSharePoint Foundation Unified Logging Service a088Verbose Stack: <stack><function depth=’1′ signature=’ logMessage() ‘></function></stack>8c182889-c323-46f3-a287-a538c379f15210/14/2011 21:29:55.76 w3wp.exe (0x097C) 0x0F6CSharePoint Foundation Unified Logging Service a089Verbose TeamName: Simple ULS Logging8c182889-c323-46f3-a287-a538c379f15210/14/2011 21:29:55.76 w3wp.exe (0x097C) 0x0F6CSharePoint Foundation Unified Logging Service a08aVerbose OriginalFileName: loggingsample.aspx8c182889-c323-46f3-a287-a538c379f152

    In this log, you see that a trace message was sent by the logMessage function.

In a sandboxed solution, you cannot deploy any file to the server file system (the Layouts folder), so to make the ULS logging script work, you need to make the following two changes:

  1. Provision the jquery-1.6.4.min.js and ULSLogScript.js file to a Site Collection–relative Styles Library folder (or any other library with appropriate read access).
  2. Update the script references in the consumer Content Query Web Part (CQWP), as needed.

The remaining functionality should work as is.

10 Must-Have Visual Studio Productivity Add-Ins I use everyday and recommend to every . Net Developer

Visual Studio provides a rich extensibility model that developers at Microsoft and in the community have taken advantage of to provide a host of quality add-ins. Some add-ins contribute significant how-did-I-live-without-this functionality, while others just help you automate that small redundant task you constantly find yourself performing.
ClickHandler.ashx
10 Must-Have Add-Ins

TestDriven.NET
GhostDoc
Paster
CodeKeep
PInvoke.NET
VSWindowManager PowerToy
WSContractFirst
VSMouseBindings
CopySourceAsHTML
Cache Visualizer

In this article, I introduce you to some of the best Visual Studio add-ins available today that can be downloaded for free. I walk through using each of the add-ins, but because I am covering so many I only have room to introduce you to the basic functionality.
Each of these add-ins works with Visual Studio .NET 2003 and most of them already have versions available for Visual Studio 2005. If a Visual Studio 2005 version is not available as of the time of this writing, it should be shortly.


TestDriven.NET
Test-driven development is the practice of writing unit tests before you write code, and then writing the code to make those tests pass. By writing tests before you write code, you identify the exact behavior your code should exhibit and, as a bonus, at the end you have 100 percent test coverage, which makes extensive refactoring possible.
NUnit gives you the ability to write unit tests using a simple syntax and then execute those tests one by one or altogether against your app. If you are using Visual Studio Team System, you have unit testing functionality built into the Visual Studio IDE. Before the Visual Studio Team System, there was TestDriven.NET, an add-in that integrates NUnit directly into the Visual Studio IDE. Using a non-Team System version of Visual Studio 2005 or Visual Studio .NET 2003, is, in my opinion, still the best solution available.
TestDriven.NET adds unit testing functionality directly to the Visual Studio IDE. Instead of writing a unit test, switching over to the NUnit GUI tool, running the test, then switching back to the IDE to code, and so on, you can do it all right in the IDE.


Figure 1 New Testing Options from TestDriven.NET 
After installing TestDriven.NET you will find a number of new menu items on the right-click context menu as shown in Figure 1. You can right-click directly on a unit test and run it. The results will be displayed in the output window as shown in Figure 2.


Figure 2 Output of a Unit Test 
While executing unit tests in the IDE is invaluable by itself, perhaps the best feature is that you can also quickly launch into the debugger by right-clicking on a test and selecting Test With | Debugger. This will launch the debugger and then execute your unit tests, hitting any breakpoints you have set in those tests.
In fact, it doesn’t even have to be a unit test for TestDriven.NET to execute it. You could just as easily test any public method that returns void. This means that if you are testing an old app and need to walk through some code, you can write a quick test and execute it right away.
TestDriven.NET is an essential add-in if you work with unit tests or practice test-driven development. (If you don’t already, you should seriously consider it.) TestDriven.NET was written by Jamie Cansdale and can be downloaded from http://www.testdriven.net.


GhostDoc
XML comments are invaluable tools when documenting your application. Using XML comments, you can mark up your code and then, using a tool like nDoc, you can generate help files or MSDN-like Web documentation based on those comments. The only problem with XML documentation is the time it takes to write it you often end up writing similar statements over and over again. The goal of GhostDoc is to automate the tedious parts of writing XML comments by looking at the name of your class or method, as well as any parameters, and making an educated guess as to how the documentation should appear based on recommended naming conventions. This is not a replacement for writing thorough documentation of your business rules and providing examples, but it will automate the mindless part of your documentation generation.
For instance consider the method shown here:

private void SavePerson(Person person) { }

After installing GhostDoc, you can right-click on the method declaration and choose Document this. The following comments will then be added to your document:

///  /// Saves the person. ///  ///Person. private void SavePerson(Person person) { }

As you can see, GhostDoc has automatically generated a summary based on how the method was named and has also populated the parameter comments. Don’t stop hereyou should add additional comments stating where the person is being saved to or perhaps give an example of creating and saving a person. Here is my comment after adding some additional information by hand:

///  /// Saves a person using the configured persistence provider. ///  ///The Person to be saved private void SavePerson(Person person) { }
Adding these extra comments is much easier since the basic, redundant portion is automatically generated by GhostDoc. GhostDoc also includes options that allow you to modify existing rules and add additional rules that determine what kind of comments should be generated.
GhostDoc was written by Roland Weigelt and can be downloaded from http://www.roland-weigelt.de/ghostdoc.


Smart Paster
Strings play a large role in most applications, whether they are comments being used to describe the behavior of the system, messages being sent to the user, or SQL statements that will be executed. One of the frustrating parts of working with strings is that they never seem to paste correctly into the IDE. When you are pasting comments, the strings might be too long or not aligned correctly, leaving you to spend time inserting line breaks, comment characters, and tabbing. When working with strings that will actually be concatenated, you have to do even more work, usually separating the parts of the string and inserting concatenation symbols or using a string builder.
The Smart Paster add-in helps to limit some of this by providing a number of commands on the right-click menu that let you paste a string from the clipboard into Visual Studio using a certain format. After installing Smart Paster, you will see the new paste options available on the right-click menu (see Figure 3).


Figure 3 String Pasting Options from Smart Paster 
For instance, you might have the following string detailing some of your business logic:

To update a person record, a user must be a member of the customer service group or the manager group. After the person has been updated, a letter needs to be generated to notify the customer of the information change.

You can copy and paste this into Visual Studio using the Paste As | Comment option, and you would get the following:

//To update a person record a user must be a member of the customer //service group or the manager group. After the person has been updated //a letter needs to be generated to notify the customer of the //information change.
The correct comment characters and carriage returns are automatically inserted (you can configure at what length to insert a character return). If you were inserting this text without the help of Smart Paster, it would paste as one long line, forcing you to manually add all the line breaks and comment characters. As another example, let’s say you have the following error message that you need to insert values into at run time:

You do not have the correct permissions to perform <insert action>. You must be a member of the <insert group> to perform this action.

Using the Paste As | StringBuilder command, you can insert this string as a StringBuilder into Visual Studio. The results would look like this:

StringBuilder stringBuilder = new StringBuilder(134); stringBuilder.AppendFormat( @"You do not have the correct permissions to "); stringBuilder.AppendFormat( @"perform . You must be a member of "); stringBuilder.AppendFormat( @"the  to perform this action.");

It would then simply be a matter of modifying the code to replace the variables sections of the string:

StringBuilder stringBuilder = new StringBuilder(134); stringBuilder.AppendFormat( @"You do not have the correct permissions to "); stringBuilder.AppendFormat( @"perform {0}. You must be a member of ", action); stringBuilder.AppendFormat( @"the {0} to perform this action.", group);

Smart Paster is a time-saving add-in that eliminates a lot of the busy work associated with working with strings in Visual Studio. It was written by Alex Papadimoulis.


CodeKeep
Throughout the process of software development, it is common to reuse small snippets of code. Perhaps you reuse an example of how to get an enum value from a string or a starting point on how to implement a certain pattern in your language of choice.
Visual Studio offers some built-in functionality for working with code snippets, but it assumes a couple of things. First, it assumes that you are going to store all of your snippets on your local machine, so if you switch machines or move jobs you have to remember to pack up your snippets and take them with you. Second, these snippets can only be viewed by you. There is no built-in mechanism for sharing snippets between users, groups, or the general public.
This is where CodeKeep comes to the rescue. CodeKeep is a Web application that provides a place for people to create and share snippets of code in any language. The true usefulness of CodeKeep is its Visual Studio add-in, which allows you to search quickly through the CodeKeep database, as well as submit your own snippets.
After installing CodeKeep, you can search the existing code snippets by selecting Tools | CodeKeep | Search, and then using the search screen shown in Figure 4.


Figure 4 Searching Code Snippets with CodeKeep 
From this screen you can view your own snippets or search all of the snippets that have been submitted to CodeKeep. When searching for snippets, you see all of the snippets that other users have submitted and marked as public (you can also mark code as private if you want to hide your bad practices). If you find the snippet you are looking for, you can view its details and then quickly copy it to the clipboard to insert into your code.
You can also quickly and easily add your own code snippets to CodeKeep by selecting the code you want to save, right-clicking, and then selecting Send to CodeKeep.This will open a new screen that allows you to wrap some metadata around your snippet, including comments, what language it is written in, and whether it should be private or public for all to see.
Whenever you write a piece of code and you can imagine needing to use it in the future, simply take a moment to submit it; this way, you won’t have to worry about managing your snippets or rewriting them in the future. Since CodeKeep stores all of your snippets on the server, they are centralized so you don’t have to worry about moving your code from system to system or job to job.
CodeKeep was written by Arcware’s Dave Donaldson and is available from http://www.codekeep.net.


PInvoke.NET
API calls within the .NET Framework. One of the hard parts of using P/Invoke is determining the method signature you need to use; this can often be an exercise in trial and error. Sending incorrect data types or values to an unmanaged API can often result in memory leaks or other unexpected results.
PInvoke.NET is a wiki that can be used to document the correct P/Invoke signatures to be used when calling unmanaged Win32 APIs. A wiki is a collaborative Web site that anyone can edit, which means there are thousands of signatures, examples, and notes about using P/Invoke. Since the wiki can be edited by anyone, you can contribute as well as make use of the information there.
While the wiki and the information stored there are extremely valuable, what makes them most valuable is the PInvoke.NET Visual Studio add-in. Once you have downloaded and installed the PInvoke.NET add-in, you will be able to search for signatures as well as submit new content from inside Visual Studio. Simply right-click on your code file and you will see two new context items: Insert PInvoke Signatures and Contribute PInvoke Signatures and Types.

Figure 5 Using PInvoke.NET 
When you choose Insert PInvoke Signatures, you’ll see the dialog box shown in Figure 5. Using this simple dialog box, you can search for the function you want to call. Optionally, you can include the module that this function is a part of. Now, a crucial part of all major applications is the ability to make the computer Beep. So I will search for the Beep function and see what shows up. The results can be seen in Figure 6.

Figure 6 Finding the Beep Function in PInvoke.NET 
.NET. The wiki suggests alternative managed APIs, letting you know that there is a new method System.Console.Beep in the .NET Framework 2.0.
There is also a link at the bottom of the dialog box that will take you to the corresponding page on the wiki for the Beep method. In this case, that page includes documentation on the various parameters that can be used with this method as well as some code examples on how to use it.
After selecting the signature you want to insert, click the Insert button and it will be placed into your code document. In this example, the following code would be automatically created for you:

[DllImport("kernel32.dll", SetLastError=true)] [return: MarshalAs(UnmanagedType.Bool)] static extern bool Beep( uint dwFreq, uint dwDuration);

You then simply need to write a call to this method and your computer will be beeping in no time.

The PInvoke.NET wiki and Visual Studio add-in take away a lot of the pain and research time sometimes involved when working with the Win32 API from managed code. The wiki can be accessed at http://www.pinvoke.net, and the add-in can be downloaded from the Helpful Tools link found in the bottom-left corner of the site.


VSWindowManager PowerToy
The Visual Studio IDE includes a huge number of different Windows, all of which are useful at different times. If you are like me, you have different window layouts that you like to use at various points in your dev work. When I am writing HTML, I like to hide the toolbox and the task list window. When I am designing forms, I want to display the toolbox and the task list. When I am writing code, I like to hide all the windows except for the task list. Having to constantly open, close, and move windows based on what I am doing can be both frustrating and time consuming.
Visual Studio includes the concept of window layouts. You may have noticed that when you start debugging, the windows will automatically go back to the layout they were in the last time you were debugging. This is because Visual Studio includes a normal and a debugging window layout.
Wouldn’t it be nice if there were additional layouts you could use for when you are coding versus designing? Well, that is exactly what VSWindowManager PowerToy does.
After installing VSWindowManager PowerToy, you will see some new options in the Window menu as shown in Figure 7.


Figure 7 VSWindowManager Layout Commands 
The Save Window Layout As menu provides commands that let you save the current layout of your windows. To start using this power toy, set up your windows the way you like them for design and then navigate to the Windows | Save Window Layout As | My Design Layout command. This will save the current layout. Do the same for your favorite coding layout (selecting My Coding Layout), and then for up to three different custom layouts.
VSWindowManager will automatically switch between the design and coding layouts depending on whether you are currently viewing a designer or a code file. You can also use the commands on the Apply Window Layout menu to choose from your currently saved layouts. When you select one of the layouts you have saved, VSWindowManager will automatically hide, show, and rearrange windows so they are in the exact same layout as before.
VSWindowManager PowerToy is very simple, but can save you a lot of time and frustration. VSWindowManager is available from vswindowmanager.codeplex.com/.


WSContractFirst
Visual Studio makes creating Web services deceptively easy You simply create an .asmx file, add some code, and you are ready to go. ASP.NET can then create a Web Services Description Language (WSDL) file used to describe behavior and message patterns for your Web service.
There are a couple problems with letting ASP.NET generate this file for you. The main issue is that you are no longer in control of the contract you are creating for your Web service. This is where contract-first development comes to the rescue. Contract-first development, also called contract-driven development, is the practice of writing the contract (the WSDL file) for your Web service before you actually write the Web service itself. By writing your own WSDL file, you have complete control over how your Web service will be seen and used, including the interface and data structures that are exposed.
Writing a WSDL document is not a lot of fun. It’s kind of like writing a legal contract, but using lots of XML. This is where the WSContractFirst add-in comes into play. WSContractFirst makes it easier to write your WSDL file, and will generate client-side and server-side code for you, based on that WSDL file. You get the best of both worlds: control over your contract and the rapid development you are used to from Visual Studio style services development.
The first step to using WSContractFirst is to create your XML schema files. These files will define the message or messages that will be used with your Web services. Visual Studio provides an easy-to-use GUI interface to define your schemasthis is particularly helpful since this is one of the key steps of the Web service development process. Once you have defined your schemas you simply need to right-click on one of them and choose Create WSDL Interface Description. This will launch the Generate WSDL Wizard, the first step of which is shown in Figure 8.

Figure 8 Building a WSDL File with WSContractFirst  
Step 1 collects the basics about your service including its name, namespace, and documentation. Step 2 allows you to specify the .xsd files you want to include in your service. The schema you selected to launch this wizard is included by default. Step 3 allows you to specify the operations of your service. You can name the operation as well as specify whether it is a one-way or request/response operation. Step 4 gives you the opportunity to enter the details for the operations and messages. Step 5 allows you to specify whether a element should be created and whether or not to launch the code generation dialog automatically when this wizard is done. Step 6 lets you specify alternative .xsd paths. Once the wizard is complete, your new WSDL file is added to your project.
Now that you have your WSDL file there are a couple more things WSContractFirst, can do for you. To launch the code generation portion of WSContractFirst, you simply need to right-click on your WSDL file and select Generate Web Service Code. This will launch the code generation dialog box shown in Figure 9.

Figure 9 WSContractFirst Code Generation Options 
You can choose to generate a client-side proxy or a service-side stub, as well as configure some other options about the code and what features it should include. Using these code generation features helps speed up development tremendously.
If you are developing Web services using Visual Studio you should definitely look into WSContractFirst and contract-first development. WSContractFirst was written by Thinktecture’s Christian Weyer.


VSMouseBindings
Your mouse probably has five buttons, so why are you only using three of them? The VSMouseBindings power toy provides an easy to use interface that lets you assign each of your mouse buttons to a Visual Studio command.
VSMouseBindings makes extensive use of the command pattern. You can bind mouse buttoms to various commands, such as open a new file, copy the selected text to the clipboard, or just about anything else you can do in Visual Studio. After installing VSMouseBindings you will see a new section in the Options dialog box called VsMouseBindings. The interface can be seen in Figure 10.

Figure 10 VSMouseBindings Options for Visual Studio 
As you can see, you can select a command for each of the main buttons. You probably shouldn’t mess around with the left and right mouse buttons, though, as their normal functionality is pretty useful. The back and forward buttons, however, are begging to be assigned to different commands. If you enjoy having functionality similar to a browser’s back and forward buttons, then you can set the buttons to the Navigate.Backward and Navigate.Forward commands inVisual Studio.
The Use this mouse shortcut in menu lets you set the scope of your settings. This means you can configure different settings when you are in the HTML designer as opposed to when you are working in the source editor.
VSMouseBindings is available from archive.msdn.microsoft.com/VSMouseBindings.


CopySourceAsHTML
Code is exponentially more readable when certain parts of that code are differentiated from the rest by using a different color text. Reading code in Visual Studio is generally much easier than trying to read code in an editor like Notepad.
Chances are you may have your own blog by now, or at least have spent some time reading them. Normally, when you try to post a cool code snippet to your blog it ends up being plain old text, which isn’t the easiest thing to read. This is where the CopySourceAsHTML add-in comes in to play. This add-in allows you to copy code as HTML, meaning you can easily post it to your blog or Web site and retain the coloring applied through Visual Studio.
After installing the CopySourceAsHTML add-in, simply select the code you want to copy and then select the Copy Source as HTML command from the right-click menu. After selecting this option you will see the dialog box shown in Figure 11.

Figure 11 Options for CopySourceAsHTML 

From here you can choose what kind of HTML view you want to create. This can include line numbers, specific tab sizes, and many other settings. After clicking OK, the HTML is saved to the clipboard. For instance, suppose you were starting with the following code snippet inside Visual Studio:

private long Add(int d, int d2) { return (long) d + d2; }
Figure 12 HTML Formatted Code  
After you select Copy As HTML and configure the HTML to include line numbers, this code will look like Figure 12 in the browser. Anything that makes it easier to share and understand code benefits all of us as it means more people will go to the trouble of sharing knowledge and learning from each other.
CopySourceAsHTML was written by Colin Coller and can be downloaded from copysourceashtml.codeplex.com/.


Cache Visualizer
Visual Studio 2005 includes a new debugging feature called visualizers, which can be used to create a human-readable view of data for use during the debugging process. Visual Studio 2005 includes a number of debugger visualizers by default, most notably the DataSet visualizer, which provides a tabular interface to view and edit the data inside a DataSet. While the default visualizers are very valuable, perhaps the best part of this new interface is that it is completely extensible. With just a little bit of work you can write your own visualizers to make debugging that much easier.
While a lot of users will write visualizers for their own custom complex types, some developers are already posting visualizers for parts of the Framework. I am going to look at one of the community-built visualizers that is already available and how it can be used to make debugging much easier.
The ASP.NET Cache represents a collection of objects that are being stored for later use. Each object has some settings wrapped around it, such as how long it will be cached for or any cache dependencies. There is no easy way while debugging to get an idea of what is in the cache, how long it will be there, or what it is watching. Brett Johnson saw that gap and wrote Cache Visualizer to examine the ASP.NET cache.
Once you have downloaded and installed the visualizer you will see a new icon appear next to the cache object in your debug windows, as shown in Figure 13.

Figure 13 Selecting Cache Visualizer While Debugging 
When you click on the magnifying glass to use the Cache Visualizer a dialog box appears that includes information about all of the objects currently stored in the ASP. NET cache, as you can see in Figure 14.

Figure 14 Cache Visualizer Shows Objects in the ASP.NET Cache 
Under Public Cache Entries, you can see the entries that I have added to the cache. The entries under Private Cache Entries are ones added by ASP.NET. Note that you can see the expiration information as well as the file dependency for the cache entry.
The Cache Visualizer is a great tool when you are working with ASP.NET. It is also representative of some of the great community-developed visualizers we will see in the future.


Wrapping It Up
While this article has been dedicated to freely available add-ins, there are also a host of add-ins that can be purchased for a reasonable price. I encourage you to check out these other options, as in some cases they can add some tremendous functionality to the IDE. This article has been a quick tour of some of the best freely available add-ins for Visual Studio. Each of these add-ins may only do a small thing, but together they help to increase your productivity and enable you to write better code.

What is Kendo UI

Kendo UI is an HTML5, jQuery-based framework for building modern web apps. The framework features lots of UI widgets, a rich data vizualization framework, an auto-adaptive Mobile framework, and all of the tools needed for HTML5 app development, such as Data Binding, Templating, Drag-and-Drop API, and more.

Kendoui


Kendo UI comes in different bundles:

  • Kendo UI Web – HTML5 widgets for desktop browsing experience.
  • Kendo UI DataViz – HTML5 data vizualization widgets.
  • Kendo UI Mobile – HTML5 framework for building hybrid mobile applications.
  • Kendo UI Complete – includes Kendo UI Web, Kendo UI DataViz and Kendo UI Mobile.
  • Telerik UI for ASP.NET MVC – Kendo UI Complete plus ASP.NET MVC wrappers for Kendo UI Web, DataViz and Mobile.
  • Telerik UI for JSP – Kendo UI Complete plus JSP wrappers for Kendo UI Web and Kendo UI DataViz.
  • Telerik UI for PHP – Kendo UI Complete plus PHP wrappers for Kendo UI Web and Kendo UI DataViz.

Installing and Getting Started with Kendo UI

You can download all Kendo UI bundles from the download page.

The distribution zip file contains the following:

  • /examples – quick start demos.
  • /js – minified JavaScript files.
  • /src – complete source code. Not available in the trial distribution.
  • /styles – minified CSS files and theme images.
  • /wrappers – server-side wrappers. Available in Telerik UI for ASP.NET MVC, JSP or PHP.
  • changelog.html – Kendo UI release notes.

Using Kendo UI

To use Kendo UI in your HTML page you need to include the required JavaScript and CSS files.

Kendo UI Web

  1. Download Kendo UI Web and extract the distribution zip file to a convenient location.
  2. Copy the /js and /styles directories of the Kendo UI Web distribution to your web application root directory.
  3. Include the Kendo UI Web JavaScript and CSS files in the head tag of your HTML page. Make sure the common CSS file is registered before the theme CSS file. Also make sure only one combined script file is registered. For more information, please refer to the Javascript Dependencies page.
    <!-- Common Kendo UI Web CSS -->
    <link href="styles/kendo.common.min.css" rel="stylesheet" />
    <!-- Default Kendo UI Web theme CSS -->
    <link href="styles/kendo.default.min.css" rel="stylesheet" />
    <!-- jQuery JavaScript -->
    <script src="js/jquery.min.js"></script>
    <!-- Kendo UI Web combined JavaScript -->
    <script src="js/kendo.web.min.js"></script>
    
  4. Initialize a Kendo UI Web Widget (the KendoDatePicker in this example):
    <!-- HTML element from which the Kendo DatePicker would be initialized -->
    <input id="datepicker" />
    <script>
    $(function() {
        // Initialize the Kendo DatePicker by calling the kendoDatePicker jQuery plugin
        $("#datepicker").kendoDatePicker();
    });
    </script>
    

Here is the complete example:

<!--doctype html>
<html>
    <head>
        <title>Kendo UI Web</title>
        <link href="styles/kendo.common.min.css" rel="stylesheet" />
        <link href="styles/kendo.default.min.css" rel="stylesheet" />
        <script src="js/jquery.min.js"></script>
        <script src="js/kendo.web.min.js"></script>
    </head>
    <body>
        <input id="datepicker" />
        <script>
            $(function() {
                $("#datepicker").kendoDatePicker();
            });
        </script>
    </body>
</html>

Kendo UI DataViz

  1. Download Kendo UI DataViz and extract the distribution zip file to a convenient location.
  2. Copy the /js and /styles directories of the Kendo UI DataViz distribution to your web application root directory.
  3. Include the Kendo UI DataViz JavaScript and CSS files in the head tag of your HTML page:
    <!-- Kendo UI DataViz CSS -->
    <link href="styles/kendo.dataviz.min.css" rel="stylesheet" />
    <!-- jQuery JavaScript -->
    <script src="js/jquery.min.js"></script>
    <!-- Kendo UI DataViz combined JavaScript -->
    <script src="js/kendo.dataviz.min.js"></script>
    
  4. Initialize a Kendo UIDataViz Widget (the Kendo Radial Gauge in this example):
    <!-- HTML element from which the Kendo Radial Gauge would be initialized -->
    <div id="gauge"></div>
    <script>
    $(function() {
        $("#gauge").kendoRadialGauge();
    });
    </script>
    

Here is the complete example:

<!--doctype html>
<html>
    <head>
        <title>Kendo UI DataViz</title>
        <link href="styles/kendo.dataviz.min.css" rel="stylesheet" />
        <script src="js/jquery.min.js"></script>
        <script src="js/kendo.dataviz.min.js"></script>
    </head>
    <body>
        <div id="gauge"></div>
        <script>
        $(function() {
            $("#gauge").kendoRadialGauge();
        });
        </script>
    </body>
</html>

Kendo UI Mobile

  1. Download Kendo UI Mobile and extract the distribution zip file to a convenient location.
  2. Copy the /js and /styles directories of the Kendo UI Mobile distribution to your web application root directory.
  3. Include the Kendo UI Mobile JavaScript and CSS files in the head tag of your HTML page:
    <!-- Kendo UI Mobile CSS -->
    <link href="styles/kendo.mobile.all.min.css" rel="stylesheet" />
    <!-- jQuery JavaScript -->
    <script src="js/jquery.min.js"></script>
    <!-- Kendo UI Mobile combined JavaScript -->
    <script src="js/kendo.mobile.min.js"></script>
    
  4. Initialize a Kendo Mobile Application
    <!-- Kendo Mobile View -->
    <div data-role="view" data-title="View" id="index">
        <!--Kendo Mobile Header -->
        <header data-role="header">
            <!--Kendo Mobile NavBar widget -->
            <div data-role="navbar">
                <span data-role="view-title"></span>
            </div>
        </header>
        <!--Kendo Mobile ListView widget -->
        <ul data-role="listview">
          <li>Item 1</li>
          <li>Item 2</li>
        </ul>
        <!--Kendo Mobile Footer -->
        <footer data-role="footer">
            <!-- Kendo Mobile TabStrip widget -->
            <div data-role="tabstrip">
                <a data-icon="home" href="#index">Home</a>
                <a data-icon="settings" href="#settings">Settings</a>
            </div>
        </footer>
    </div>
    <script>
    // Initialize a new Kendo Mobile Application
    var app = new kendo.mobile.Application();
    </script>
    

Here is the complete example:

<!--doctype html>
<html>
    <head>
        <title>Kendo UI Mobile</title>
        <link href="styles/kendo.mobile.all.min.css" rel="stylesheet" />
        <script src="js/jquery.min.js"></script>
        <script src="js/kendo.mobile.min.js"></script>
    </head>
    <body>
        <div data-role="view" data-title="View" id="index">
            <header data-role="header">
                <div data-role="navbar">
                    <span data-role="view-title"></span>
                </div>
            </header>
            <ul data-role="listview">
              <li>Item 1</li>
              <li>Item 2</li>
            </ul>
            <footer data-role="footer">
                <div data-role="tabstrip">
                    <a data-icon="home" href="#index">Home</a>
                    <a data-icon="settings" href="#settings">Settings</a>
                </div>
            </footer>
        </div>
        <script>
        var app = new kendo.mobile.Application();
        </script>
    </body>
</html>

Server-side wrappers

Kendo UI provides server-side wrappers for ASP.NET, PHP and JSP. Those are classes (ASP.NET and PHP) or XML tags (JSP) which allow configuring the Kendo UI widgets with server-side code.

You can find more info about the server-side wrappers here:

  • Get Started with Telerik UI for ASP.NET MVC
  • Get Started with Telerik UI for JSP
  • Get Started with Telerik UI for PHP

Next Steps

Kendo UI videos

You can watch the videos in the Kendo UI YouTube channel.

Kendo UI Dojo

A lot of interactive tutorials are available in the Kendo UI Dojo.

Further reading

  1. Kendo UI Widgets
  2. Data Attribute Initialization
  3. Requirements

Examples

  1. Online demos
  2. Code library projects
  3. Examples availableongithub
    • ASP.NET MVC examples
    • ASP.NET MVC Kendo UI Music Store
    • ASP.NET WebForms examples
    • JSP examples
    • Kendo Mobile Sushi
    • PHP examples
    • Ruby on Rails examples

Help Us Improve Kendo UI Documentation, Samples, Tutorials and Demos

The Kendo UI team would LOVE your help to improve our documentation. We encourage you to contribute in the way that you choose:

Submit a New Issue at GitHub

Open a new issue on the topic if it does not exist already.When creating an issue, please provide a descriptive title, be as specific as possible and link to the document in question. If you can provide a link to the closest anchor to the issue, that is even better.

Update the Documentation at GitHub

This is the most direct method. Follow the contribution instructions. The basic steps are that you fork our documentation and submit a pull request. That way you can contribute to exactly where you found the error and our technical writing team just needs to approve your change request. Please use only standard Markdown and follow the directions at the link. If you find an issue in the docs, or even feel like creating new content, we are happy to have your contributions!

Forums

You can also go to the Kendo UI Forums and leave feedback. This method will take a bit longer to reach our documentation team, but if you like the accountability of forums and you want a fast reply from our amazing support team, leaving feedback in the Kendo UI forums guarantees that your suggestion has a support number and that we’ll follow up on it.Thank you for contributing to the Kendo UI community!

NEW “Filter My Lists” Web Part now available + FREE Metro UI Master Page when ordering

“Filter My Lists” Web Part

Saves you time with optimal performance

Find what you are looking for with a few clicks, even in cluttered sites and lists with masses of items and documents.

Find exactly what you need and stop wasting your time browsing SharePoint.
Filter the content of multiple lists and libraries in a single   step.

Combine search and metadata filters

In a single panel combine item, document and attachment searches with metadata keyword searches and managed metadata filters.

Select multiple filter values from drop-down lists or alternatively use the keyword search of metadata fields with the help of wildcard characters and logical operators.

Export filtered views to Excel

Export filtered views and data to Excel. A print view enables you to print your results in a clear printable format with a single  click.

Keep views clear and concise

Provides a complete set of filters without cluttering list views and keeps your list views clear, concise and speedy. Enables you to filter SharePoint using columns which aren’t visible in list views.

Refine filters and save them for future use, whether private, to share with others or to use as default filters.

FREE Metro Style UI Master Page


Screen Capture Medium

Modern UI Master Page and Styles for SharePoint 2010.

This will give the Metro/Modern UI styling of SharePoint 2013 to your SharePoint 2010 team sites.

Features include:
– Quick launch styling
– Global navigation and drop-down styling
– Search box styling and layout change
– Web part header styling
– Segoe UI font

How to Create Custom SharePoint 2010 Page Layouts using SharePoint Designer 2010

Scenario:

You’re working with the Enterprise Wiki Site Template and you don’t really like where the “Last modified…” information is located (above the content). You want to move that information to the bottom of the page.

Option 1: Modify the “EnterpriseWiki.aspx” Page Layout directly.

Option 2: Create a new Page Layout based on the original one and then modify that one.

We’ll go ahead and go with Option 2 since we don’t want to modify the out of the box template just in case we need it later on.

How To:

Step 1

Navigate to the top level site of the Site Collection > Site Actions > Site Settings > Master pages (Under the Galleries section). Then switch over to the Documents tab in the Ribbon and then click New > Page Layout.

Step 2

Select the Enterprise Wiki Page Content Type to associate with, give it a URL and Title. Note that there’s also a link on this page to create a new Content Type. You might be interested in doing this if you wanted to say, add more editing fields or metadata properties to the layout. For example if you wanted to add another Managed Metadata column to capture folksonomy aside from the already included “Wiki Categories” Managed Metadata column.

Step 3

SharePoint Designer time! Hover over your newly created Page Layout and “Edit in Microsoft SharePoint Designer.”

Step 4

Now you can choose to build your page manually by dragging your SharePoint Controls onto the page and laying them out as you’d like…

… Or you can copy and paste the OOB Enterprise Wiki Page Layout. I think I’ll do that. 🙂

Step 5

Alright, so you’ve copied the contents of the EnterpriseWiki.aspx Page Layout and now it’s time for some customizing. I found the control I want to move, so I’ll simply do a copy or cut/paste to the new spot.

Step 6

Check-in, publish, and approve the new Page Layout. Side note: I like to add the Check-In/Check-Out/Discard or Undo-Checkout buttons to all of my Office Applications’ Quick Access Toolbars for convenience.

Step 7

Almost there! Navigate to your publishing site, in this case the Enterprise Wiki Site, then go to Site Actions > Site Settings > Page layouts and site templates (Under Look and Feel). Here you’ll be able to make the new Page Layout available for use within the site.

Step 8

Go back to your site and edit the page that you’d like to change the layout for. On the Page tab of the Ribbon, click on Page Layout and select your custom Page Layout.

Et voila! You just created a custom Page Layout using SharePoint Designer 2010, re-arranged a SharePoint control and managed to plan for the future by not modifying the out of the box template. That was a really simple example but I hope it helped to give you some ideas on how else you can customize Page Layouts within SharePoint 2010!

2132

Visio for Developers in Office 365

In this post, I’ll introduce some of the new features of interest to developers in Visio 2013. Among these features are:

  • New file format
  • Robust updates to themes
  • The change shape feature (that allows you to replace one shape with another while Maintaining shape text)
  • New shape effects
  • Improvements to commenting
  • Coauthoring on SharePoint Server 2013
  • Customizable image clipping
  • Relative geometry
  • Support for Business Connectivity Services (BCS) data
  • Updates to Visio Services in Microsoft SharePoint Server 2013
  • Duplicate page feature

At the end of the post, I provide you with some additional resources for both Visio and general Office development.


New file format

Visio 2013 introduces a new file format, based on the Open Packaging Conventions (OPC) standard (ISO 29500, Part 2) and the XML elements from the previous Visio XML file format (.vdx). It is a zipped, XML-based file format similar to the file formats used in other applications.

Because the new file format is supported by both Visio 2013 and Visio Services in Microsoft SharePoint Server 2013, you can save a Visio drawing directly to a SharePoint Server library without having to first publish the file as a Visio Web Drawing (.vdw). Even so, Visio Services can still read and display Visio Web Drawing files.

The new file format includes the following file types (by extension):

  • .vsdx (Visio drawing)
  • .vsdm (Visio macro-enabled drawing)
  • .vssx (Visio stencil)
  • .vssm (Visio macro-enabled stencil)
  • .vstx (Visio template)
  • .vstm (Visio macro-enabled template)

By using existing support for reading and writing to the file format package (such as System.IO.Packaging) and for parsing XML (System.Xml.Linq), you can work with the new file formats programmatically.

Visio 2013 retains the ability to read the old file formats (.vsd, .vss, .vst, .vdx, .vsx, .vtx, .vdw, .vwi). Visio 2013 does not save to the previous Visio XML file format (.vdx). Solutions or tools that consume the previous Visio XML file format (.vdx) files may need to be refactored in order to read the new file format and its schemas.

Visio Services retains the ability to display the Visio Web Drawing (.vdw) format in the browser. It now also renders the new Visio drawing (.vsdx) and Visio macro-enabled drawing (.vsdm) formats.

For more information about the new file format, see the article How to: Manipulate the Visio 2013 file format programmatically.

Themes

Themes have been redesigned in Visio 2013, making use of a greater variety of effects and styles including the integration of Shape Art effects. Users can now decide on an overarching style by applying a theme, personalize the diagram with theme variants, and highlight individual shapes with Quick Styles. ShapeSheet developers can take advantage of these features with new functions and cells in the ShapeSheet.

The user interface for applying theme variants is shown in the following figure.


You can also manipulate themes at the Page, Shape, and Selection object level. New APIs for working with themes include Page.SetTheme method, Page.SetThemeVariant method, Shape.SetQuickStyle method, and the Selection.SetQuickStyle method.

For more information about new VBA objects and members in Visio 2013, see the Visio Automation reference. For more information about the new ShapeSheet cells in Visio 2013, see the article What’s new for ShapeSheet developers in Visio 2013.

Change Shape

Visio 2013 includes a shape replacement API that enables you to swap one or more shapes for another shape contained in a stencil, while retaining some of the local values from the original shape, like the shape text shape, shape data, or shape formatting. Shape developers can update the ShapeSheet settings of their custom shapes to specify the Change Shape behavior for their shapes. Among the new APIs for Change Shape are the Shape.ReplaceShape and Selection.ReplaceShape methods and the ReplaceShapesEvent object.

The Change Shape feature lets you easily change a shape (in this case, the green rectangle)…


…to another shape, the green diamond.

For more information about the Change Shape feature, see Eric Schmidt’s blog post, Change shapes in Visio 2013.

For more information about new VBA objects and members in Visio 2013, see the Visio Automation reference. For more information about the new ShapeSheet cells in Visio 2013, see the article What’s new for ShapeSheet developers in Visio 2013.

Shape effects

New shape effects such as bevel, 3-D rotation, glow, reflection, and sketching have been added to Visio 2013. The ShapeSheet includes new cells for working with these effects. The following figure shows a shape to which effects have been applied.

You can also use Office VBA objects such as TextFrame2, GlowFormat, and ReflectionFormat and their members to apply shape effects.

For more information about the new ShapeSheet cells in Visio 2013, see the article What’s new for ShapeSheet developers in Visio 2013.

Commenting

Visio 2013 includes a new commenting framework. Comments can now be associated with a particular shape or page. Visio 2013 includes two new objects, Comments and Comment. New APIs for accessing comments programmatically include the Document.Comments, Page.Comments, Shape.Comments, and Page.ShapeComments properties.

The following images show what comments looked like in Visio 2010 and what they look like in Visio 2013.


Visio Services includes JavaScript APIs to read the comments from a page or shape in a diagram.

Note: You can no longer access comments in the ShapeSheet.

Coauthoring

Visio 2013 includes the ability to co-author diagrams stored on SharePoint or OneDrive. Developers have access to the Document.AfterDocumentMerge event which provides information about diagram changes due to coauthoring. Solution developers also have the ability to disable coauthoring to suit their custom needs by using the NoCoauth cell on the Document ShapeSheet.

Customizable image clipping

Visio 2013 supports defining a Custom Image Clipping path to crop images to any shape. This extends the capacities of Visio 2010, which supported clipping images in a rectangular way. This functionality is available in the ShapeSheet by using the ClippingPath cell in the Foreign Image Info section.

Relative geometries

In previous versions of Visio, shape geometry was defined by formulas that depended on the height or width of the shape. For example, in Visio 2010 the vertices of many built-in Visio shapes were defined by multiplying the height or width of the shape by a constant. These shapes had Geometry sections that included MoveTo or LineTo rows (for example) with formulas like Width1 and Height0.

Visio 2013 now supports relative geometry in the ShapeSheet. Shape developers can now use relative geometries to specify geometries as simple values or formulas, which multiply by the height or width automatically. You can now express Shape vertices by using constants, for instance—you no longer need to express vertices as multiples of the shape width or height. This makes it easier for you to create shapes that have better performance and smaller file sizes. New rows include the RelMoveTo and RelLineTo rows where the X and Y cell values are automatically multiplied by the width or height of the shape (respectively).

Support for Business Connectivity Services (BCS) data

Visio 2013 diagrams can now be connected to external lists on SharePoint Server 2013 servers. An external list is a content source external to SharePoint (for example, a SQL Server table) that has been connected to a SharePoint list by using Microsoft Business Connectivity Services (BCS). Visio Services supports the ability to refresh the Visio diagrams as the data updates.

For more information about what’s new in Visio Services, see the article Visio Services in SharePoint 2013. For more information about Business Connectivity Services (BCS), see Business Connectivity Services in SharePoint 2013.

Improvements in Visio Services

Visio Services in Microsoft SharePoint Server 2013 includes many improvements. As mentioned previously, Visio Services supports the new Visio file format (.vsdx and .vsdm). Visio Services has expanded data refresh and recalculation, including the ability to recalculate formulas across an entire diagram.

For more information about what’s new in Visio Services, see the article Visio Services in SharePoint 2013.

Duplicate page

You can now copy a page and all of its shapes within the same document in Visio 2013. Accordingly, the Page object has a new method, Duplicate, which duplicates the page and returns a new Page object.

Additional resources

Great tool to handle storing constants in SharePoint Development


Today I want to introduce something I’ve been working on recently which could be of use to you if you’re a SharePoint developer. Often when developing SharePoint solutions which require coding, the developer faces a decision about what to do with values he/she doesn’t want to ‘hardcode’ into the C# or VB.Net code. Example values for a SharePoint site/application/control could be:

‘AdministratorEmail’ – ‘bob@somewhere.com’
‘SendWorkflowEmails’ – ‘true’

Generally we avoid hardcoding such values, since if the value needs to be changed we have to recompile the code, test and redeploy. So, alternatives to hardcoding which folks might consider could be:

  • store values in appSettings section of web.config
  • store values in different places, e.g. Feature properties, event handler registration data, etc.
  • store values in a custom SQL table
  • store values in a SharePoint list

Personally, although I like the facility to store complex custom config sections in web.config, I’m not a big fan of appSettings. If I need to change a value, I have to connect to the server using Remote Desktop and open and modify the file – if I’m in a server farm with multiple front-ends, I need to repeat this for each, and I’m also causing the next request to be slow because the app domain will unload to refresh the config. Going through the other options, the second isn’t great because we’d need to be reactivating Features/event receiver registrations every time (even more hassle), though the third (using SQL) is probably fine, unless I want a front-end to make modifying the values easier, in which case we’d have some work to do.

So storing config values in a SharePoint list could be nice, and is the basis for my solution. Now I’d bet lots of people are doing this already – it’s pretty quick to write some simple code to fetch the value, and this means we avoid the hardcoding problem. However, the Config Store ‘framework’ goes further than this – for one thing it’s highly-optimized so you can be sure there is no negative performance impact, but there are also some bonuses in terms of where it can used from and the ease of deployment. So what I hope to show is that the Config Store takes things quite a bit further than just a simple implementation of ‘retrieving config values from a list’.

Details (reproduced from the Codeplex site)

The list used to store config items looks like this (N.B. the items shown are my examples, you’d add your own):

ConfigStoreList.jpg
There is a special content type associated with the list, so adding a new item is easy:

ConfigItemContentType.jpg

..and the content type is defined so that all the required fields are mandatory:

AddNewConfigItem.jpg

Retrieving values

Once a value has been added to the Config Store, it can be retrieved in code as follows (you’ll also need to add a reference to the Config Store assembly and ‘using’ statement of course):

string sAdminEmail = ConfigStore.GetValue("MyApplication", "AdminEmail");

Note that there is also a method to retrieve multiple values with a single query. This avoids the need to perform multiple queries, so should be used for performance reasons if your control/page will retrieve many items from the Config Store – think of it as a best practise. The code is slightly more involved, but should make sense when you think it through. We create a generic List of ‘ConfigIdentifiers’ (a ConfigIdentifier specifies the category and name of the item e.g. ‘MyApplication’, ‘AdminEmail’) and pass it to the ‘GetMultipleItems()’ method:

List<ConfigIdentifier> configIds = new List<ConfigIdentifier>();

ConfigIdentifier adminEmail = new ConfigIdentifier("MyApplication", "AdminEmail");
ConfigIdentifier sendMails = new ConfigIdentifier("MyApplication", "SendWorkflowEmails");
configIds.Add(adminEmail);
configIds.Add(sendMails);
Dictionary<ConfigIdentifier, string> configItems = ConfigStore.GetMultipleValues(configIds);
string sAdminEmail = configItems[adminEmail];
string sSendMails = configItems[sendMails];

..the method returns a generic Dictionary containing the values, and we retrieve each one by passing the respective ConfigIdentifier we created earlier to the indexer.

Other notes

    • All items are wrapped up in a Solution/Feature so there is no need to manually create site columns/content types/the Config Store list etc. There is also an install script for you to easily install the Solution.

      • Config items are cached in memory, so where possible there won’t even be a database lookup!

        • The Config Store is also designed to operate where no SPContext is present e.g. a list event receiver. In this scenario, it will look for values in your SharePoint web application’s web.config file to establish the URL for the site containing the Config Store (N.B. these web.config keys get automatically added when the Config Store is installed to your site). This also means it can be used outside your SharePoint application, e.g. a console app.

          • The Config Store can be moved from it’s default location of the root web for your site. For example sites I create usually have a hidden ‘config’ web, so I put the Config Store in here, along with other items. (To do this, create a new list (in whatever child web you want) from the ‘Configuration Store list’ template (added during the install), and modify the ‘ConfigWebName’/’ConfigListName’ keys which were added to your web.config to point to the new location. As an alternative if you already added 100 items which you don’t want to recreate, you could use my other tool, the SharePoint Content Deployment Wizard at http://www.codeplex.com/SPDeploymentWizard to move the list.)

            • All source code and Solution/Feature files are included, so if you want to change anything, you can

              • Installation instructions are in the readme.txt in the download

              Summary

              Hopefully you might agree that the Config Store goes beyond a simple implementation of ‘storing config values in a list’. For me, the key aspects are the caching and the fact that the entire solution is ‘joined up’, so it’s easy to deploy quickly and reliably as a piece of functionality. Many organizations are probably at the stage where their SharePoint codebase is becoming mature and perhaps based on a foundation of a ‘core API’ – the Config Store could provide a useful piece in such a toolbox.

              You can download the Config Store framework and all the source code from www.codeplex.com/SPConfigStore.

              How To : Use Powershell Scripts in Office 365 through the SharePoint CSOM

              When we first started to work with Office 365, I remember being quite concerned at the lack of PowerShell cmdlets – basically all the commands we’re used to using do not exist there. Here’s a gratuitous graph to illustrate the point:

              image

              So yes, nearly 800 PowerShell commands in SP2013 (up from around 530 in SP2010) down to a measly 30 in SharePoint Online. And those 30 mainly cover basic operations with sites, users and permissions – no scripting of, say, Managed Metadata, user profiles, search and so on. It’s true to say that some of these things are now available down at site-collection scope (needed, of course, when you don’t have a true “Central Admin” site but there are still “tenant-level” settings that you want to use script for rather than make manual changes through the UI.

              So what’s a poor developer/administrator to do?

              The answer is to write PowerShell as you always did, but embed CSOM code in there. More examples later, but here’s a small illustration:

              # get the site collection scoped Features collections (e.g. to activate one) – not showing how to obtain $clientContext here..
              $siteFeatures = $clientContext.Site.Features
              $clientContext.Load($siteFeatures)
              $clientContext.ExecuteQuery()

              So we’re using the .NET CSOM, but instead of C# we are using PowerShell’s ability to call any .NET object (indeed, nearly every script will use PowerShell’s New-Objectcommand). All the things we came to love about PowerShell are back on the table:

              • Scripts can be easily amended, no need to recompile (or open Visual Studio)
              • We can debug with PowerGui or PowerShell ISE
              • We can leverage other things PowerShell is good at e.g. easily reading from XML files, using other PowerShell modules and other APIs (including .NET) etc.

              Of course, we can only perform operations where the method exists in the .NET CSOM – that’s the boundary of what we can do.

              Getting started

              Step 1 – understand the landscape

              The first thing to understand is that there are actually 3 different approaches for scripting against Office 365/SharePoint Online, depending on what you need to do. It might just be me, but I think that when you start it’s easy to get confused between them, or not fully appreciate that they all exist. The 3 approaches I’m thinking of are:

              • SharePoint Online cmdlets
              • MSOL cmdlets
              • PowerShell + CSOM

              This post focuses on the last flavor. I also wrote a short companion post about the overall landscape and with some details/examples on the other flavors, at Using SharePoint Online and MSOL cmdlets in PowerShell with Office 365

              Step 2 – prepare the machine you will run scripts against SharePoint Online

              Option 1 – if you will NOT run scripts from a SP2013 box (e.g. a SP2013 VM):

              You need to obtain the SharePoint DLLs which comprise the .NET CSOM, and copy them to a folder on your machine – your scripts will reference these DLLs.

              1. Go to any SharePoint 2013 server, and copy any DLL
              2. which starts with Microsoft.SharePoint.Client*.dll from the C:\Program Files\Common Files\microsoft shared\Web Server Extensions\15\ISAPI folder.
              3. Store them in a folder on your machine e.g. C:\Lib – make a note of this location.

              CSOM DLLs

              Option 2 – if you WILL run scripts from a SP2013 box (e.g. a SP2013 VM):

              In this case, there is no need to copy the DLLs – your scripts will reference them in the original SharePoint install location (C:\Program Files\Common Files\microsoft shared\Web Server Extensions\15\ISAPI).

              The top of your script – referencing DLLs and authentication

              Each .ps1 file which calls the SharePoint CSOM needs to deal with two things before you can use the API – loading the CSOM types, and authenticating/obtaining a ClientContext object. So, you’ll need this at the top of your script:

              ** N.B. My newer code samples do not show in RSS Readers – click here for full article **
              # replace these details (also consider using Get-Credential to enter password securely as script runs)..
              $username = “SomeUser@SomeOrg.onmicrosoft.com”
              $password = “SomePassword”
              $securePassword = ConvertTo-SecureString $Password -AsPlainText -Force
              # the path here may need to change if you used e.g. C:\Lib..
              Add-Type -Path “c:\Program Files\Common Files\microsoft shared\Web Server Extensions\15\ISAPI\Microsoft.SharePoint.Client.dll”
              Add-Type -Path “c:\Program Files\Common Files\microsoft shared\Web Server Extensions\15\ISAPI\Microsoft.SharePoint.Client.Runtime.dll”
              # note that you might need some other references (depending on what your script does) for example:
              Add-Type -Path “c:\Program Files\Common Files\microsoft shared\Web Server Extensions\15\ISAPI\Microsoft.SharePoint.Client.Taxonomy.dll”
              # connect/authenticate to SharePoint Online and get ClientContext object..
              $clientContext = New-Object Microsoft.SharePoint.Client.ClientContext($url)
              $credentials = New-Object Microsoft.SharePoint.Client.SharePointOnlineCredentials($username, $securePassword)
              $clientContext.Credentials = $credentials
              if (!$clientContext.ServerObjectIsNull.Value)
              {
              Write-Host “Connected to SharePoint Online site: ‘$Url'” -ForegroundColor Green
              }
              view rawTopOfScript_PSCSOM.ps1 hosted with ❤ by GitHub

              In the scripts which follow, we’ll include this “top of script” stuff by dot-sourcing TopOfScript.ps1 in every script below – you could follow a similar approach (perhaps with a different name!) or simply paste that stuff into every script you create. If you enter a valid set of credentials and URL, running the script above should see you ready to rumble:

              PS CSOM got context

              Script examples

              Activating a Feature in SPO

              Something you might want to do at some point is enable or disable a Feature using script. The script below, like the others that follow it, all reference my TopOfScript.ps1 script above:

              ** N.B. My newer code samples do not show in RSS Readers – click here for full article **
              . .\TopOfScript.ps1
              [bool]$enable = $true
              [bool]$force = $false
              # using the Minimal Download Strategy Feature here..
              $FeatureId = [GUID](“87294C72-F260-42f3-A41B-981A2FFCE37A”)
              # ..and working with the web-scoped Features – use $clientContext.Site.Features for site-scoped Features
              $webFeatures = $clientContext.Web.Features
              $clientContext.Load($webFeatures)
              $clientContext.ExecuteQuery()
              if ($enable)
              {
              $webfeatures.Add($featureId, $force, [Microsoft.SharePoint.Client.FeatureDefinitionScope]::None)
              }
              else
              {
              $webfeatures.Remove($featureId, $force)
              }
              try
              {
              $clientContext.ExecuteQuery()
              if ($enable)
              {
              Write-Host “Feature ‘$FeatureId’ successfully activated..”
              }
              else
              {
              Write-Host “Feature ‘$FeatureId’ successfully deactivated..”
              }
              }
              catch
              {
              Write-Error “An error occurred whilst activating/deactivating the Feature. Error detail: $($_)
              }
              view rawActivateOrDeactivateFeature_PSCSOM.ps1 hosted with ❤ by GitHub

              PS CSOM activate feature

              Enable side-loading (for app deployment)

              Along very similar lines (because it also involves activating a Feature), is the idea of enabling “side-loading” on a site. By default, if you’re developing a SharePoint app it can only be F5 deployed from Visual Studio to a site created from the Developer Site template, but by enabling “side-loading” you can do it on (say) a team site too. Since the Feature isn’t visible (in the UI), you’ll need a script like this:

              ** N.B. My newer code samples do not show in RSS Readers – click here for full article **
              . .\TopOfScript.ps1
              [bool]$enable = $true
              [bool]$force = $false
              # this is the side-loading Feature ID..
              $FeatureId = [GUID](“AE3A1339-61F5-4f8f-81A7-ABD2DA956A7D”)
              # ..and this one is site-scoped, so using $clientContext.Site.Features..
              $siteFeatures = $clientContext.Site.Features
              $clientContext.Load($siteFeatures)
              $clientContext.ExecuteQuery()
              if ($enable)
              {
              $siteFeatures.Add($featureId, $force, [Microsoft.SharePoint.Client.FeatureDefinitionScope]::None)
              }
              else
              {
              $siteFeatures.Remove($featureId, $force)
              }
              try
              {
              $clientContext.ExecuteQuery()
              if ($enable)
              {
              Write-Host “Feature ‘$FeatureId’ successfully activated..”
              }
              else
              {
              Write-Host “Feature ‘$FeatureId’ successfully deactivated..”
              }
              }
              catch
              {
              Write-Error “An error occurred whilst activating/deactivating the Feature. Error detail: $($_)
              }
              view rawEnableSideLoading_PSCSOM.ps1 hosted with ❤ by GitHub

              PS CSOM enable side loading

              Iterating webs

              Sometimes you might want to loop through all the webs in a site collection, or underneath a particular web:

              ** N.B. My newer code samples do not show in RSS Readers – click here for full article **
              1234567891011121314151617181920
              . .\TopOfScript.ps1
              $rootWeb = $clientContext.Web
              $childWebs = $rootWeb.Webs
              $clientContext.Load($rootWeb)
              $clientContext.Load($childWebs)
              $clientContext.ExecuteQuery()
              function processWeb($web)
              {
              $lists = $web.Lists
              $clientContext.Load($web)
              $clientContext.ExecuteQuery()
              Write-Host “Web URL is” $web.Url
              }
              foreach ($childWeb in $childWebs)
              {
              processWeb($childWeb)
              }
              view rawIterateWebs.ps1 hosted with ❤ by GitHub

              PS CSOM iterate webs

              (Worth noting that you also see SharePoint-hosted app webs also in the image above, since these are just subwebs (albeit ones which get accessed on the app domain URL rather than the actual host site’s web application URL).

              Iterating webs, then lists, and updating a property on each list

              Or how about extending the sample above to not only iterate webs, but also the lists in each – the property I’m updating on each list is the EnableVersioning property, but you easily use any other property or method in the same way:

              ** N.B. My newer code samples do not show in RSS Readers – click here for full article **
              . .\TopOfScript.ps1
              $enableVersioning = $true
              $rootWeb = $clientContext.Web
              $childWebs = $rootWeb.Webs
              $clientContext.Load($rootWeb)
              $clientContext.Load($childWebs)
              $clientContext.ExecuteQuery()
              function processWeb($web)
              {
              $lists = $web.Lists
              $clientContext.Load($web)
              $clientContext.Load($lists)
              $clientContext.ExecuteQuery()
              Write-Host “Processing web with URL “ $web.Url
              foreach ($list in $web.Lists)
              {
              Write-Host “– “ $list.Title
              # leave the “Master Page Gallery” and “Site Pages” lists alone, since these have versioning enabled by default..
              if ($list.Title -ne “Master Page Gallery” -and $list.Title -ne “Site Pages”)
              {
              Write-Host “—- Versioning enabled: “ $list.EnableVersioning
              $list.EnableVersioning = $enableVersioning
              $list.Update()
              $clientContext.Load($list)
              $clientContext.ExecuteQuery()
              Write-Host “—- Versioning now enabled: “ $list.EnableVersioning
              }
              }
              }
              foreach ($childWeb in $childWebs)
              {
              processWeb($childWeb)
              }
              view rawIterateWebsAndListsEnableVersioning.ps1 hosted with ❤ by GitHub

              PS CSOM iterate lists enable versioning

              Import search schema XML

              In SharePoint 2013 and Office 365, many aspects of search configuration (such as Managed Properties and Crawled Properties, Query Rules, Result Sources and Result Types) can be exported and importing between environments as an XML file. The sample below shows the import operation handled with PS + CSOM:

              ** N.B. My newer code samples do not show in RSS Readers – click here for full article **
              . .\TopOfScript.ps1
              # need some extra types bringing in for this script..
              Add-Type -Path “c:\Program Files\Common Files\microsoft shared\Web Server Extensions\15\ISAPI\Microsoft.SharePoint.Client.Search.dll”
              # TODO: replace this path with yours..
              $pathToSearchSchemaXmlFile = “C:\COB\Cloud\PS_CSOM\XML\COB_TenantSearchConfiguration.xml”
              # we can work with search config at the tenancy or site collection level:
              #$configScope = “SPSiteSubscription”
              $configScope = “SPSite”
              $searchConfigurationPortability = New-Object Microsoft.SharePoint.Client.Search.Portability.SearchConfigurationPortability($clientContext)
              $owner = New-Object Microsoft.SharePoint.Client.Search.Administration.SearchObjectOwner($clientContext, $configScope)
              [xml]$searchConfigXml = Get-Content $pathToSearchSchemaXmlFile
              $searchConfigurationPortability.ImportSearchConfiguration($owner, $searchConfigXml.OuterXml)
              $clientContext.ExecuteQuery()
              Write-Host “Search configuration imported” -ForegroundColor Green
              view rawImportSearchSchema.ps1 hosted with ❤ by GitHub

              PS CSOM import search schema

              Summary

              As you can hopefully see, there’s lots you can accomplish with the PowerShell and CSOM combination. Anything that can be done with CSOM API can be wrapped into a script, and you can build up a library of useful PowerShell snippets just like the old days. There are some interesting things that you CANNOT do with CSOM (such as automating the process of uploading/deploying a sandboxed WSP to Office 365), but there ARE approaches for solving even these problems, and I’ll most likely cover this (and our experiences) in future posts.

              A final idea on the PowerShell + CSOM front is the idea that you can have “hybrid” scripts which can deal with both SharePoint Online and on-premises SharePoint. For example, on my current project everything we build must be deployable to both SPO and on-premises, and our scripts take a “DeploymentTarget” parameter where the values can be “Online” or “OnPremises”. There are some differences (i.e. branching) in the scripts, but for many operations the same commands can be run.

              Introduction to the Microsoft Monitoring Agent

              You can now download the Microsoft Monitoring Agent and install on any server in your enterprise that meet the minimum installation requirements.

              The Microsoft Monitoring Agent is a simple installation that is included with System Center Operations Manager 2012 R2 or can be installed separately to be used in a standalone manner. When using the Microsoft Monitoring Agent as a standalone tool the data captured is available as a Visual Studio IntelliTrace file. These files can be opened with Visual Studio Ultimate 2013 Release Candidate.

              The rest of this post will focus on using the Microsoft Monitoring Agent in a standalone mode.

              Using MMA in standalone mode

              After installing the Microsoft Monitoring Agent you enable monitoring of your IIS hosted application using PowerShell commands. Let’s say that I have installed my application (FabrikamFiber) under the default application node on my IIS server as shown below.

              To start monitoring this application I use the following PowerShell command running as Administrator:

              A couple of things to notice:

              • The name of the application that I am monitoring includes the site name (Default Web Site) as well as the application name (FabrikamFiber.Web).
              • I chose the monitor mode. My options are to use monitor, trace, or custom. I will focus on the monitor mode in this blog post.
              • The output path is a file location that I have already created. You may wish to make this location shared so that both developers and operations team members can access the files that get created in that location.

              Monitoring mode has been designed to have minimal impact on the running application and only records data when the Microsoft Monitoring Agent detects undesirable behavior such as problematic exceptions occur or performance is poor. The default settings record exceptions that bubble up to the global exception handler and pages that  take longer than 5 seconds to respond from the server. In addition to the conditions that trigger data collection the Microsoft Monitoring Agent will also limit the frequency in which it will record data to a maximum of 60 similar events per day.

              There are a couple of approaches that you can take to use the Microsoft Monitoring Agent in monitoring mode effectively. One method is to gather an IntelliTrace file after a problem has been reported. A more proactive approach is to gather an IntelliTrace file on a regular schedule, such as daily, to check for problematic behavior in your application that may not have been reported by your users.

              Generating and Using the IntelliTrace file

              To produce an IntelliTrace file you use the Checkpoint-WebApplicationMonitoring command as shown below:

              The IntelliTrace file can then be opened using Visual Studio 2013 Release Candidate. Any performance violations are listed in the Performance Data section of the IntelliTrace Summary page and exceptions are shown in the Exceptions section.

              Diagnosing exceptions remains very similar to the experience available with Visual Studio 2012. Diagnosing performance events is detailed in a separate blog post.

              For detailed information on the Microsoft Monitoring Agent refer to TechNet.

              For expanded scenarios and usage information refer to MSDN.

              Client-side PowerShell for SharePoint Online and Office 365

              SharePoint PowerShell is a PowerShell API for SharePoint 2010, 2013 and Online. Very usefull for Office 365 and private clouds where you don’t have access to the physical server.

              Image

              The API uses the Managed .NET Client-Side Object Model (CSOM) of SharePoint 2013. It’s a library of PowerShell Scripts and in it’s core it talks to the CSOM dll’s.

              Examples :

              Import-Module .\spps.psm1 
              
              Initialize-SPPS -siteURL "https://example.sharepoint.com/" -online $true -username "sitecollectionadmin@example.onmicrosoft.com" -password "password"
              Example
              # Include SPPS
              Import-Module .\spps.psm1 
              
              # Setup SPPS
              Initialize-SPPS -siteURL "https://example.sharepoint.com/" -online $true -username "sitecollectionadmin@example.onmicrosoft.com" -password "password"
              
              # Activate Publishing Site Feature
              Activate-Feature -featureId "f6924d36-2fa8-4f0b-b16d-06b7250180fa" -force $false -featureDefinitionScope "Site"
              
              #Activate Publishing Web Feature
              Activate-Feature -featureId "94c94ca6-b32f-4da9-a9e3-1f3d343d7ecb" -force $false -featureDefinitionScope "Web"

              Features

              • Site Collection
                • Test connection
              • Site
                • Manage subsites
                • Manage permissions
              • Lists and Document Libraries
                • Create list and document library
                • Manage fields
                • Manage list and list item permissions
                • Upload files to document library (including folders)
                • Add items to a list with CSV
                • Add and remove list items
                • File check-in and check-out
              • Master pages
                • Set system master page
                • Set custom master page
              • Features
                • Activate features
              • Web Parts
                • Add Web Parts to page
              • Users and Groups
                • Set site permissions
                • Set list permissions
                • Set document permissions
                • Create SharePoint groups
                • Add users and groups to SharePoint groups
              • Solutions
                • Upload sandboxed solutions
                • Activate sandboxed solutions

                Contact me at tomas.floyd@outlook.com for this and more Azure,SharePoint & Office 365 Tools, Web Parts and Apps

              FREE – SharePoint 2013 Search Query Tool

              This tool helps you understand and learn how the available parameters on the Search REST service should be formatted.


              What does this tool offer:

              • Issue HTTP GET or POST search queries.
              • See how the different Query parameters are formatted.
              • Authenticate using different users to debug security trimming issues.
              • Use against your tenant on SharePoint Online and authenticate using your SPO User ID.


              Go get it from:

              http://sp2013searchtool.codeplex.com/


              modern.IE – Great tool for testing Web Sites! Get it now!

              ImageThe modern.IE scan analyzes the HTML, CSS, and JavaScript of a site or application for common coding issues. It warns about practices such as incomplete specification of CSS properties, invalid or incorrect doctypes, and obsolete versions of popular JavaScript libraries.

              It’s easiest to use modern.IE by going to the modern.IE site and entering the URL to scan there. To customize the scan, or to use the scan to process files behind a firewall, you can clone and build the files from this repo and run the scan locally.

              How it works

              The modern.IE local scan runs on a system behind your firewall; that system must have access to the internal web site or application that is to be scanned. Once the files have been analyzed, the analysis results are sent back to the modern.IE site to generate a complete formatted report that includes advice on remediating any issues. The report generation code and formatted pages from the modern.IE site are not included in this repo.

              Since the local scan generates JSON output, you can alternatively use it as a standalone scanner or incorporate it into a project’s build process by processing the JSON with a local script.

              The main service for the scan is in the app.js file; it acts as an HTTP server. It loads the contents of the web page and calls the individual tests, located in /lib/checks/. Once all the checks have completed, it responds with a JSON object representing the results.

              Installation and configuration

              • Install node.js. You can use a pre-compiled Windows executable if desired. Version 0.10 or higher is required.
              • If you want to modify the code and submit revisions, Install git. You can choose GitHub for Windows instead if you prefer. Then clone this repository. If you just want to run locally then downloading then you just need to download the latest version from here and unzip it
              • Install dependencies. From the Modern.ie subdirectory, type: npm install
              • If desired, set an environment variable PORT to define the port the service will listen on. By default the port number is 1337. The Windows command to set the port to 8181 would be: set PORT=8181
              • Start the scan service: From the Modern.ie subdirectory, type: node app.js and the service should respond with a status message containing the port number it is using.
              • Run a browser and go to the service’s URL; assuming you are using the default port and are on the same computer, the URL would be: http://localhost:1337/
              • Follow the instructions on the page.

              Testing

              The project contains a set of unit tests in the /test/ directory. To run the unit tests, type grunt nodeunit.

              JSON output

              Once the scan completes, it produces a set of scan results in JSON format:

              {
                  "testName" : {
                      "testName": "Short description of the test",
                      "passed" : true/false,
                      "data": { /* optional data describing the results found */ }
                  }
              }

              The data property will vary depending on the test, but will generally provide further detail about any issues found.

              Great tool available for Responsive Web Pages in SharePoint!!

              Web designers are crucial for a successful SharePoint implementation. We all know that. With this in mind, I wanted to write an article for our SharePoint web designers out there. Not being an authority on the subject, I decided to ask someone who has been working in web design for some time. By asking my contacts, I got the email address of an expert in SharePoint branding and UX customization. Eric Overfield was the name on the contact card. I set up a conference call, and very soon we were chatting and discussing UX, branding, artists, engineers, and SharePoint.

              The conversation quickly turned to devices and how to make SharePoint work as well as possible in this new and changing set of displays. Eric’s answer was: responsive web design. Responsive web design allows us to look at a site like a fluid grid. The fluid, dynamic grid adapts itself to fit the information in display resolutions as different as those in a phone, a tablet, and a full desktop monitor. Keep in mind that the mix of display resolutions doubles if you consider landscape and portrait orientations available in all these devices.

              The author of the original post about responsive web design, Ethan Marcotte, provided a reference site to demo the concepts explained in his post. In this demo, you can observe how the elements in the page rearrange themselves to fit the current resolution as you resize your browser window. The demo left me wondering how a SharePoint website would react to different resolutions by using the fluid grid characteristic of responsive frameworks. Fortunately, Eric, along with some other people, developed Responsive SharePoint. Responsive SharePoint is a CodePlex project that you can use to try responsive frameworks on your SharePoint website.

              I followed the provided instructions to install the resources by using Design Manager on an out-of-the-box publishing site. In no time, I was looking at how the site dynamically reacted to different resolutions as I resized my browser window. I decided to test the project by using the following display resolutions:

              • 1200×1900 (desktop, portrait orientation)
              • 768×1366 (tablet, portrait orientation)
              • 480×800 (smartphone, portrait orientation)

              The results were amazing. Within 10 minutes, I had a SharePoint website that automatically adapts to display resolutions commonly used in devices. The following figure compares the website in commonly used display resolutions:

              Figure 1. Comparison of resolutions of the SharePoint website using a responsive frameworkFigure 1. Comparison of resolutions of the SharePoint website using a responsive framework

              How is this achieved?

              In this post, I can only explain that Responsive SharePoint uses media queries to match the width of the display in the device and then applies a set of styles to present the content in the available space. For this to work, you need a browser that supports media queries. The latest version of the major browsers support such functionality. The following code example shows how to declare media queries:

              @media (min-width: 769px) and (max-width: 979px) {
                  /*
                      Styles for display width 
                      between 769 and 979 pixels
                  */
              }
              
              @media (max-width: 768px) {
                  /*
                      Styles for display width 
                      equal to 768 pixels and thinner
                  */
              }
              
              @media (min-width: 1200px) {
                  /*
                      Styles for display width 
                      equal to 1200 pixels and wider
                  */
              }

              Of course there is much more to it. You can learn more by browsing the Responsive SharePoint CodePlex project.

              The new design and branding features in SharePoint 2013 make it easy to create and edit your web design, including responsive designs. You can even use the tools you are familiar with by mapping a network drive to the SharePoint 2013 Master Page Gallery. In my case, I used Microsoft Expression Web 4 to browse and edit the master pages and CSS files.

              Looking for the SharePoint Developer Dashboard? Look no more!

              This tool is useful for measuring the behaviour and performance of individual pages.

              Can be used to monitor page load and performance

              It has three states:

              • On,
              • Off,
              • On demand.

              Activating the Developer Dashboard

              Developer Dashboard is a utility that is available in all SharePoint 2010 versions, and can be enabled in a few different ways:

              • PowerShell
              • STSADM.exe
              • SharePoint Object Model (API’s)

              Activate the Developer Dashboard using STSADM.EXE

              The Developer Dashboard state can only be toggled with a STSADM command

              • ON:

              STSADM –o setproperty –pn developer-dashboard –pv on

              • OFF:

              STSADM –o setproperty –pn developer-dashboard –pv off

              • ON DEMAND:

              STSADM –o setproperty –pn developer-dashboard –pv ondemand

              Activate the Developer Dashboard using PowerShell:

              $DevDashboardSettings = [Microsoft.SharePoint.Administration.SPWebService]::

              ContentService.DeveloperDashboardSettings;

              $DevDashboardSettings.DisplayLevel = ‘OnDemand’;

              $DevDashboardSettings.RequiredPermissions =’EmptyMask’;

              $DevDashboardSettings.TraceEnabled = $true;

              $DevDashboardSettings.Update()

              Activate the Developer Dashboard using the SharePoint Object Model

              using Microsoft.SharePoint.Administration;

              SPWebService svc = SPContext.Current.Site.WebApplication.WebService; svc.DeveloperDashboardSettings.DisplayLevel=SPDeveloperDashboardLevel.Off; svc.DeveloperDashboardSettngs.Update();

              Where is it?

              Picture2

              You can see the Developer Dashboard button In the top right.

              Developer Dashboard 3 Border Colors

              • it has a Green border, that generally means it’s loading quick enough not to be a real problem.
              • It can also render Yellow, which indicates that there’s a slight delay and
              • it could render a Red border which would mean you definitely need to look into it immediately!

              Picture3

              You see this Developer Dashboard has a yellow border color.

              Publishing apps for Office and SharePoint to Windows Azure Websites

              This post will focus on provider-hosted apps for SharePoint and apps for Office. Provider-hosted (as opposed to SharePoint-hosted or Autohosted) means that the developer is responsible for hosting the web content – which is precisely where Azure Websites can help. At the end of the post, I will also look at advanced topics, including options for publishing to a non-Azure environment (like an on-premise server).

              Direct web publishing to Azure

              Creating a profile

              Suppose you have an app for SharePoint or an app for Office that you’re ready to publish for the first time. To begin publishing your app, choose the app for SharePoint or app for Office project, and choose “Publish”.

              Figure 1. Publish menu in Solution Explorer
              Figure 1. Publish menu in Solution Explorer

              A guided publishing experience will appear, as shown below.

              Figure 2. Guided publishing experience
              Figure 2. Guided publishing experience

              For a new project, there is no current publishing profile. You can create one by selecting <New…> from the profile dropdown, which will open the following dialog box.

              Figure 3. Creating a new publishing profile
              Figure 3. Creating a new publishing profile

              If you’re publishing to Azure, choose the “download your publishing profile” link, and you’ll be redirected to the Azure portal. There, if you have not already, you can create a new website by choosing the +NEW at bottom-left corner of the portal. The bottom portion of the screen will expand, allowing you to create a new website via the Quick Create or Custom Create menu items.

              Figure 4. Creating new website on Azure portal
              Figure 4. Creating new website on Azure portal

              Once the website entity is created, choose it from the list of websites to reveal the website details. Then choose Download the publish profile and save the profile to your computer. The profile contains all the information necessary to deploy your web content, including any auxiliary information like linked database connections.

              Figure 5. Downloading the publish profile from the Azure portal
              Figure 5. Downloading the publish profile from the Azure portal

              Back in the Visual Studio dialog box, and with the import publishing profile option still selected, choose the “browse” button and browse to the newly-downloaded file. Depending on the type of app:

              • For apps for Office, the profile is now complete.
              • For apps for SharePoint, you can now configure the Client ID and Client Secret on the second page of the wizard. These values uniquely identify your app to SharePoint, and allows the app to access SharePoint data. Client IDs and Secrets are generated and registered automatically when you debug your app, but they must be registered in a more permanent fashion when publishing the app. To do so:

              At the completion of either registration process, you will be granted a Client ID and Client Secret. Transfer those values into the Profile-creation dialog, and then choose Finish.

              Deploying and packaging

              Once the profile is set, the publishing buttons will activate. You now have a choice of deploying the web project and/or packaging the app. When publishing for the first time, you will need to do both – but it generally makes sense to start with deploying the web project first.

              Deploy your web project

              Deploying your web project is exactly what it sounds like: it will publish the entire contents of your web project (but not the SharePoint app or Office manifest) to the web. To do this, choose deploy your web project and you will see the familiar web publishing experience – complete with Preview, deployment settings, and more. The Connection tab has been pre-filled with information from your publish profile, and you can go to Settings to customize the publish configuration and options like Remove additional files at destination. Note that if your project requires a database, you can set it on the Settings page of the Wizard – and that, if your publish profile came from Azure, you can simply choose the database from the dropdown list.

              Figure 6. Deploying a web project to Azure
              Figure 6. Deploying a web project to Azure

              The Preview functionality is helpful to ensure you’re publishing the right set of files. By choosing a file in the Preview list, you can see the impending changes that you’re about to commit to your live site.

              Figure 7. Preview functionality in Visual Studio
              Figure 7. Preview functionality in Visual Studio

              Packaging your app

              Once the web project is deployed, packaging the app is designed to be simple, and most fields should be pre-populated. If you used a publishing profile, the URL will already be pre-populated, though you’ll need to change the URL from “http” to “https”. Note that with Azure Websites, https hosting is automatically included for any website hosted on *.azurewebsites.net (for custom domains or other hosting providers, you may need to follow additional steps).

              For apps for Office, that’s all you need: Just choose Finish, and a manifest file that points to your live web content will get generated for you. For apps that you wish to sell on the Office Store, see the next section. Otherwise, if it’s just an in-house app, you can upload the app to a file share or to a corporate catalog.

              For apps for SharePoint, you will need to provide or confirm the Client ID, which you may have already entered during the profile-creation step. After that, click “finish” – and an app package will get created for you. Again, see the next section for apps headed for the Office Store. Otherwise, if you only intend to distribute the app to users of your SharePoint site, follow the documentation for uploading the app to a SharePoint corporate catalog.

              Publishing to the Office Store

              After your app package (apps for SharePoint) or manifest file (apps for Office) is created, you can use the Visit the Seller Dashboard button to get started with publishing to the Office Store.

              For apps for Office, you can also run your app through a validation utility, which will catch common mistakes (like not specifying required information in the manifest). This will save you time and hassle when submitting the app to the Store.

              Figure 8. Validation utility for apps for Office
              Figure 8. Validation utility for apps for Office

              Upgrading an app

              When it comes time to upgrade an existing app that you have already published, what steps do you need to take?

              For both apps for Office and apps for SharePoint, if all that you’ve updated is just in the web project, you can just re-publish the web content via the Deploy your web project button. These changes will go live immediately, and you’re fully in control of deploying these whenever you’d like.

              If you made changes to the app manifest (apps for Office and apps for SharePoint) or if you have modified any SharePoint artifacts (lists, event receivers, or anything outside the web project), you need to re-publish those artifacts instead via the Package the app button. If your app is listed on the Office Store, you will then need to re-submit to the produced app package or app manifest to the Store, so it may take a few days before those changes go live – and remember that applying an update is at the discretion of the user.

              In general, remember to be considerate of the upgrade impact when modifying anything outside of the web project. Especially for apps for SharePoint, which have a more involved upgrade process, see the Apps for SharePoint update process article for an in-depth upgrade discussion and for guidance on how to avoid breaking older app packages when deploying new web artifacts.

              Advanced topics

              Specifying multiple publish environments

              One common request we heard is to publish an app to different environments. For example, one might want to publish to a “staging” environment first, ensure that the app works properly, and only then publish to “production”.

              With the new Publish experience, switching between multiple environments is only a dropdown away. Each publish profile remembers its own URL, Client ID, and Secret, so publishing to a different profile is as easy as changing the profile dropdown and choosing the appropriate “Deploy your web project” and “Package the app” buttons.

              Figure 9. Publishing to multiple environments
              Figure 9. Publishing to multiple environments

              Configuring Client Secret (or other environmental variables) in the Azure Portal

              Sometimes, the “Client Secret” for the production app might be a closely-guarded secret. As a developer, you might have the ability to publish to the website, but you might not have access to the Client Secret itself. The same thing might be true for any other such variables.

              One way to solve this scenario is to have your Azure account Admin manage these environmental variables through the Azure Portal. For each Azure Website, it is possible to have the Client Secret – or any other variables – be set via “app settings” section of the Configure tab. The “app settings” values take precedence over values in Web.config, so you get the best of both worlds – your local F5 scenario continues to work as before, yet your published app can make of a Client Secret that you might not even have access to.

              Figure 10. Configuring a Client Secret in the Azure portal
              Figure 10. Configuring a Client Secret in the Azure portal

              Deploying outside of Azure (or to a local IIS server)

              If you need to deploy to a non-Azure hosting provider – particularly if you are publishing to an on-premises machine – you can still use the many improvements to the app-publishing experience.

              During profile-creation, choose the Create new profile radio button.

              Then, once you are ready to deploy your web content, enter the Connection credentials in the “Publish Web” wizard.

              The rest of the flow should be the same. Remember to ensure that your hosting server supports the HTTPS protocol.

              Creating a Web Deploy Package

              An alternate, but similar, case for publishing to a local IIS server is when only an IT admin has the ability to publish a website. To simplify deployment, you can provide the IT admin with a Web Deploy Package – a .zip file that contains all web artifacts.

              To do this, create a new profile rather than importing one from Azure. In the case of an app for SharePoint, you will also need to fill in some dummy Client ID and Secret values.

              Now go to Deploy your web project – but be sure to choose Web Deploy Package as the publish method in the “Connection” tab.

              Figure 11. Creating a web deploy package
              Figure 11. Creating a web deploy package

              Choose a package location (any new folder will do) and proceed with the wizard. At the end, a set of deploy scripts and a .zip file with your web content will be generated.

              Figure 12. Web deploy package files
              Figure 12. Web deploy package files

              Your IT Admin should be able to take things from here (registering the app with SharePoint and providing the Client ID and Secret into the deployment scripts). Once the web content is deployed, ask your admin to provide you with the Client ID (the secret is not needed) and proceed with the “Package the app” step. You can then send the app package – now containing the SharePoint artifacts, and pointing at the live web content – back to the IT admin to deploy to SharePoint.

              Enhanced by Zemanta

              BCS Solution Packaging Tool

              Resource Page Description

              735240_BCSSolutionPackagingTool48  http://archive.msdn.microsoft.com/odcsps14bcsgnrtrtool/Release/ProjectReleases.aspx?ReleaseId=4352
              The Business Connectivity Services (BCS) Solution Packaging Tool is intended for Power Users and Developers of Microsoft Business Connectivity Services solutions.

              With this tool you can create:
              – Intermediate Declarative Solutions (for Microsoft Outlook 2010)
              – Advanced Code-Based Solutions (utilizing a Solution Manifest, for Microsoft Outlook 2010)
              – Data Solutions (for use with Microsoft Office Professional Plus 2010 Add-Ins)

              This tool includes a help file.

              NEW
              A sample solution has been added to the Downloads page (click “Sample Solution” in the Releases navigation at the right side of the page).

              NEW
              The tool now has an option to validate the artifacts and their connections before packaging. This option is on by default, but can be turned off to speed up the packaging process.

              SharePoint Samurai